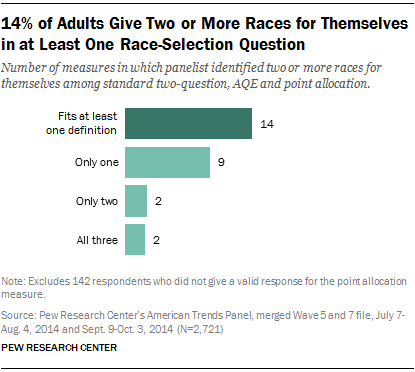
Looking only at the three questions that asked respondents to identify their race or races—standard two-question, Census AQE and point allocation—we find that many adults who select two or more races using one approach do not offer consistent responses using the other measures. Overall, 14% of adults select two or more races on at least one of the three measures. Only 2% consistently selected two or more races using all three of the approaches that asked respondents to identify their race or races.

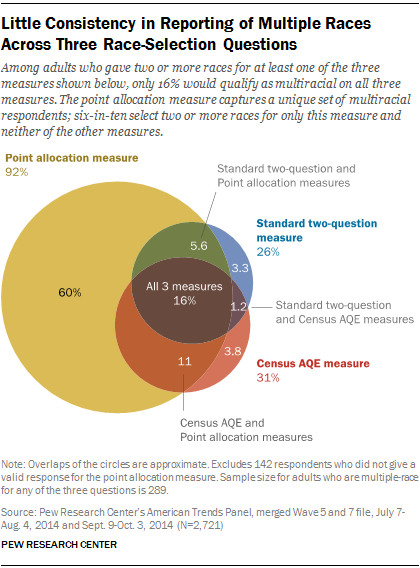
The Venn diagram to the right details the overlap and disconnect in multiple-race responses among all adults who selected two or more races on at least one of the measures. Just 16% of these adults would be considered multiracial using all three measures. A majority (60%) could only be described as multiracial using the point allocation approach, while less than 5% each would fit the definition using only the Census AQE measure or only the standard two-question measure, reflecting the greater overlap between these two approaches.
To be sure, differences in mode—in addition to question type—may be playing a role. The standard race measure was asked over the phone, point allocation over the Web and Census AQE through a mix of Web and phone modes. However, eliminating mode differences does not eliminate the unique cases within each question. For example, if analysis is limited to only respondents who answered both the point allocation and Census AQE measures via the Web, the overlapping share is similar to the overlap when the total sample is analyzed (29% and 26%, respectively).

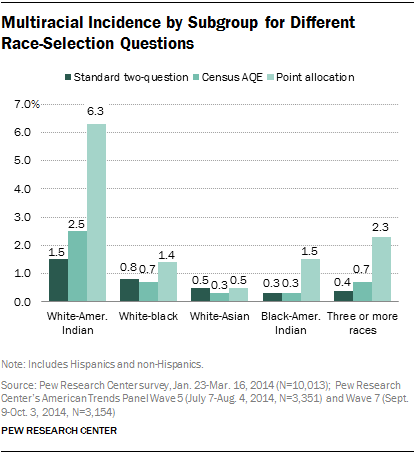
Our tests of different approaches to asking respondents to identify their race or races show that the share of adults who report an American Indian background is particularly susceptible to question-wording effects. For example, in the standard two-question approach, which doesn’t specifically list “American Indian” as an option, 1.5% of all adults said they were white and volunteered that they were also American Indian, while slightly more (2.5%) marked white and American Indian in the AQE. Using the point allocation approach, however, 6.3% assigned at least one point to white and American Indian. Similarly, more adults said they were black and American Indian in the point allocation measure (1.5%) than in the other two approaches (0.3% in each).
The share of all adults who report three or more races is also considerably higher using the point allocation approach than using the standard or AQE approaches. Less than 1% of respondents select three or more races when asked the standard race question (0.4%) or the AQE (0.7%). By comparison, 2.3% allocate points to three or more races using the point allocation measure.


