A plurality of the American public believes that young adults are having the toughest time of any age group in today’s economy—and a lopsided majority says it’s more difficult for today’s young adults than it was for their parents’ generation to pay for college, find a job, buy a home or save for the future.
A new Pew Research Center survey also finds that young adults (ages 18 to 34) say that the sluggish economy has had an impact on a wide array of coming-of-age decisions about career, marriage, parenthood and schooling.
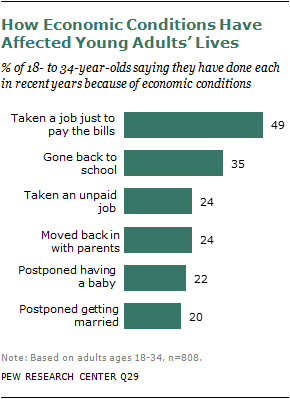
For example, nearly half (49%) say that in the past few years they have taken a job they didn’t really want just to pay the bills. Smaller but still sizable shares say that because of the tough economy they have gone back to school (35%), moved back in with their parents after living on their own (24%), postponed having children (22%) or postponed getting married (20%).
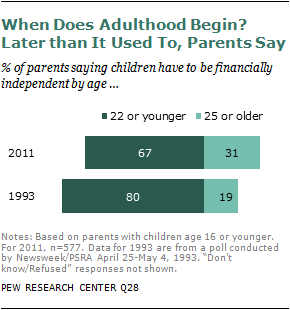
These accommodations to a tough economy appear to have contributed to a broader change in social norms about when adulthood begins. The survey finds that today two-thirds (67%) of parents of children age 16 or younger say children should have to become financially independent from their parents by the age of 22—down from 80% who felt this way in 1993.4
The view that young adults are having the toughest time of any age group in today’s economy is held by 41% of respondents of all ages to the telephone survey conducted Dec. 6-19, 2011, among a nationally representative sample of 2,048 adults. A smaller share—29%—say middle-aged adults are having the toughest time, while just 24% say older adults are having the worst of it.
Nearly half of all young adults (49%) say their age group is having the hardest time, but even in the teeth of their own downbeat assessment, their long-term economic optimism remains notably unscarred by current travails.
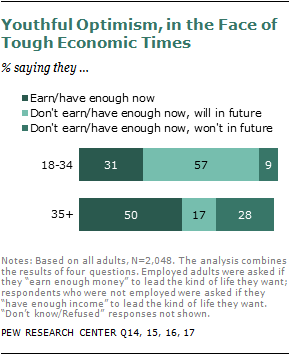
The survey finds that nearly nine-in-ten of today’s 18- to 34-year-olds say either that they already have or that they earn enough money to lead the kind of life they want (31%) or that they expect to have enough in the future (57%). Just 9% say they don’t ever anticipate having enough money to lead the kind of life they want.
Among adults ages 35 and older, the balance of opinion on this question is quite different, driven in part by life stage and in part by attitude. A much higher share—50% versus 31% among young adults—say they already earn or have enough money to lead the kind of life they want, not surprising given that more of them are in their prime earning years. But the survey also finds that a much higher share—28% of those 35 and older versus just 9% among young adults—say they don’t think they will ever have or earn enough to live the life they want.
When the same questions were asked on a survey in 2004—before the onset of a deep recession and sluggish recovery that have been especially hard on young adults—the generational patterns in the responses were nearly identical. Bad times, in short, have not shaken youthful optimism.
Only time will tell if that optimism is warranted. For now, despite the recent decline in the unemployment rate, an array of government trend data bears out the public’s verdict about the economic difficulties facing the young, especially in the realms of employment, wages and household wealth.
- Employment. In 2011, the share of young adults (18- to 24-year-olds) who were employed had fallen to 54.3%—the lowest level since the U.S. Bureau of Labor Statistics began collecting such data in 1948. Since the onset of the Great Recession in late 2007, the employment decline has been steeper for this age cohort than any other, and this drop is only partly explained by the rising share who are in college. The employment rate among those ages 25 to 34 has fallen much less precipitously in recent years and has tracked more closely with the trend in employment among middle-aged workers.
-
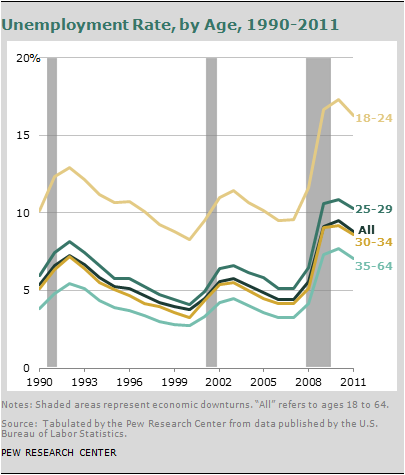
Unemployment. The unemployment rate at the end of 2011 was 16.3% for 18- to 24-year- olds, compared with 8.8% for all adults ages 18 to 64. In the past three years, the gap in the unemployment rate between 18- to 24-year-olds and all working-age adults is the widest in recorded history.
- Weekly Earnings. From 2007 to 2011, inflation-adjusted real median weekly earnings among full-time workers ages 18 to 24 fell by 6%, while earnings basically held level for all older age groups.
- Household Wealth. A Pew Research analysis of U.S. Census Bureau data finds that in 2009 (the latest year for which such data are available), the typical household headed by someone age 65 or older had 47 times the net worth of the typical household headed by someone under the age of 35. In 1984, that ratio had been ten-to-one.5
Findings from the new Pew Research survey, which oversampled adults ages 18 to 34, flesh out these gloomy statistics and paint a nuanced picture of the lives of today’s young adults.6 They are much less satisfied with their economic circumstances than they were before the recession, yet they remain just as optimistic about their financial future. Those who are working value job security over higher pay, though relatively few see their current occupation as a career.
The Recession’s Impact on the Young
A plurality of the public says young adults are having the toughest time in today’s economy, and young people themselves are indeed feeling this most acutely. Fully half (49%) of those ages 18 to 34 say young adults are struggling the most due to economic conditions. For the young, the impact of the recession and weak recovery has not been limited to the labor market. They have felt it in their day-to-day lives on many dimensions.
Among adults under age 35, 49% say that due to the bad economy over the past few years, they have taken a job they didn’t want just to pay the bills. More than one-third (35%) have gone back to school. And more than one-in-five have taken an unpaid job, moved back in with their parents, or postponed getting married or having a baby.
In the midst of these challenges, today’s young adults are clearly having a harder time than their parents did in reaching some of the most basic financial milestones. Young adults themselves feel things are more difficult now. And middle-aged and older adults agree it’s much harder to be a young adult today than it was a generation ago.
Strong majorities of all adults say it’s harder for today’s young people than it was for their parents to find a job (82%), save for the future (75%), pay for college (71%) or buy a home (69%). In some cases, middle-aged and older adults are even more likely than their younger counterparts to say today’s young people have it harder.
All of this may be contributing to a growing perception that adulthood starts later these days than it did in the past. Survey respondents were asked at about what age children should have to be financially independent from their parents. Among all survey respondents, a narrow majority (55%) say children should be financially independent by the time they are 22 years old (15% say financial independence should come by age 18, 40% place the cutoff at age 22). More than four-in-ten say children do not have to be financially independent until they are 25 or older (34% say children should be on their own by age 25, an additional 8% say age 30 or later).
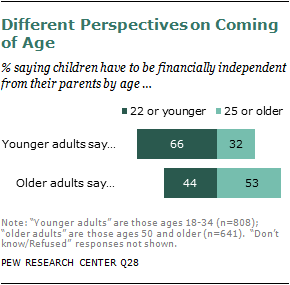
Data from a survey conducted in the early 1990s suggest that public perceptions about when adulthood should begin have shifted significantly over the years. In 1993, 80% of parents with children age 16 and under said children should be financially independent by the age of 22. Now, only 67% of parents with young children share that view.
In the current survey, there is a significant age gap on this question of when a young adult should be financially independent. Two-thirds of those younger than 35 say children should be financially independent by age 22. And nearly as many (63%) of those ages 35 to 49 say the same. However, among those ages 50 and older, less than half (44%) say children should be financially independent by age 22, while a narrow majority (53%) says this doesn’t need to happen until they are at least 25.
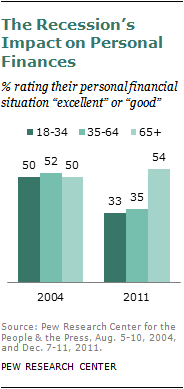
Middle-aged adults have not been immune from the hard economic times. If any group has weathered the storm more easily than others, it has been older adults—those ages 65 and older. Looking at the impact the recession has had on personal finances illustrates this point. In a 2004 Pew Research survey, roughly equal proportions of young, middle-aged and older adults rated their own personal financial situation “excellent” or “good.” When asked again at the end of 2011, the ratings of young and middle-aged adults had fallen dramatically, while the ratings for older adults were virtually unchanged.7
Youthful Optimism
Recent economic hardship has not dampened the spirits of America’s young adults. Though they have struggled to find jobs and make ends meet, they maintain a sense of optimism about their financial future.
Most young adults (68%), whether they are employed or not, don’t feel they have the resources now to lead the kind of life they want. But among those who are dissatisfied with their current income, the vast majority are optimistic that in the future they will have enough to live comfortably.
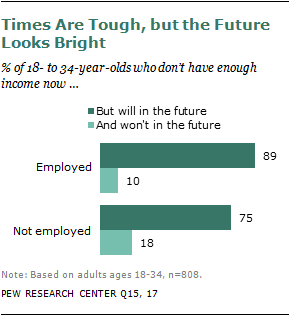
Fully nine-in-ten young adults (89%) who are employed but say they don’t earn enough money to lead the kind of life they want believe they will earn enough in the future. Only 10% expect that they will not. Among young adults who are not working and say they don’t currently have enough income, 75% are confident they will have enough income in the future (18% believe they won’t).
Not only are young adults optimistic about their own future, but they also believe their children will be better off when they reach young adulthood. Among those ages 18 to 34, 60% expect that when their children reach a comparable age their standard of living will exceed the standard of living their parents enjoy now. Among those ages 35 and older, only 43% have such high hopes for their children’s future. More than a quarter of those 35 and older (27%) believe their children’s standard of living will actually be worse than theirs is now.
For the most part, what young adults value in life mirrors the values of middle-aged and older adults—family comes first, career comes second. More than half (54%) of those ages 18 to 34 say being a good parent is one of the most important things in their life; 53% of those ages 35 and older say the same. Roughly one-third of young adults (34%) say having a successful marriage is one of the most important things in their life, as do 37% of those 35 and older. Young women value family and marriage significantly more than young men do. And young whites place more value on marriage than do young blacks.
Young Adults in the Workplace
While jobs are harder to come by for today’s young adults, those who are employed are relatively happy with their work. Nearly one-third (31%) of workers ages 18 to 34 are completely satisfied with their job, and 53% more are somewhat satisfied. Job satisfaction among young workers is roughly the same as it was in the mid-1990s and remains somewhat lower than satisfaction among workers 35 and older.8
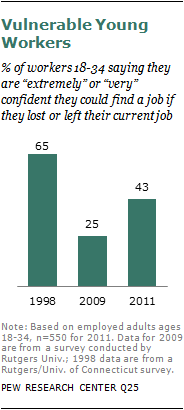
While young workers are relatively satisfied with their job, the recession may have shaken their confidence in their ability to find another job. In 1998, amid single-digit unemployment among the young, 65% of workers ages 18 to 34 said they were extremely or very confident that they could find another job if they lost or wanted to leave their current job. By 2009, the share who were extremely or very confident had plummeted to 25%. Young workers’ attitudes have rebounded somewhat since then. In the current survey, 43% express a high level of confidence that if necessary they could find a new job.9
When asked what they value more in a job—security or a high salary—workers of all ages opt for job security. By 56% to 41%, workers ages 18 to 34 say, all other things being equal, they would prefer a job that offers better job security over a higher-paying job. A similar share of older workers prefer better job security over salary (59% to 34%).
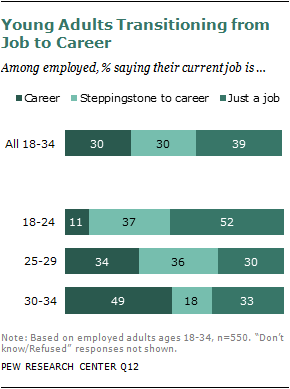
Most young workers (69%) do not view their current job as a career—30% say it is a steppingstone to a career, and 39% say it is just a job for them to get by. Only three-in-ten describe their current job as a career.
Throughout young adulthood, there is a steady progression from job to career. Among the youngest workers (ages 18 to 24), only 11% say they are currently in a career. Workers ages 25 to 29 are three times as likely as their younger counterparts to say they are in a career (34%). And among workers ages 30 to 34, nearly half view their current job as a career. In this regard, they are no different from workers ages 35 and older, 52% of whom consider their job as a career.
Among all workers ages 18 to 34, those with a college degree are among the most likely to see their current job as a career: 49% view their occupation as a career, while only 17% say it’s just a job to get them by. Young workers who are still enrolled in school are among the least likely to view their job as a career (only 13% do). However, that will presumably change once they have completed their education. Among those young workers who do not have a college degree and are not enrolled in school, fully half (49%) say they think of their current job as just a job to get them by, and only one-in-four (27%) say it’s a career. This group of workers may feel particularly vulnerable in today’s economy. Though they are not pursuing a college degree, 61% say they need more education and training in order to get ahead in their job.
About the Report
The reminder of this report is organized as follows: Chapter 2 provides a look at trends in the labor market over the past two decades. Relying mainly on data from the U.S. Bureau of Labor Statistics, employment trends are broken down by detailed age categories. Chapter 3 looks at the impact the recession has had on young adults—both generally and in more specific terms. Chapter 4 looks at young adults’ optimism in the face of economic challenges and explores their goals for the future. Chapter 5 provides a look inside the work lives of young adults.


