The net worth of a household depends on the types of assets it owns, the value of those assets and the claims on those assets. For example, the typical American household owns a home. The market price of that home determines its value but it may have a claim against it in the form of a mortgage loan. The difference between the value of the house and the amount owed on the mortgage—home equity—is the contribution of this asset to household net worth.
Changes in the net worth of a household over time depend on the same factors. The mix of assets owned by a household, for example, determines whether the drop in the value of an asset matters to it. A household with little stock ownership is less sensitive to fluctuations in the stock market. But the wealth of a household that depends on home ownership, and little else, would be very sensitive to real estate fluctuations.
This section of the report presents estimates of the typical amount of equity held by households in different types of assets. Subsequent sections of the report focus on the rates of ownership of assets and the contributions of individual assets to household net worth.
The conclusion that emerges from the asset-based analysis is that developments in the housing market are the principal agents of change in household wealth from 2005 to 2009. A home is one of the most commonly owned assets, and home equity is the single largest contributor to household wealth. Thus, plummeting housing prices had a profound impact on the net worth of most households. The effect was more pronounced for minorities because, relative to whites, housing assumes a larger share of their portfolios. Also, Hispanics and Asians were deeply affected because their population is relatively more concentrated in California, Florida, Nevada and Arizona, which experienced among the greatest declines in home prices.
Asset ownership rates also edged downward from 2005 to 2009, but in small measure. The drop in asset ownership was generally modest in comparison with the fall in the net worth of assets. Overall, declining value, not declining ownership, is at the heart of the loss in household wealth.
Median Net Worth of Individual Assets

Real estate, for either personal use or rental purposes, is the most highly valued asset owned by households. Financial assets, in the form of stocks, mutual funds, bonds and retirement accounts are also a key part of the portfolio. Of these two major groups of assets, net worth eroded the most for real estate holdings. The value of financial assets moved in different ways, depending on the specific asset and subpopulation examined.
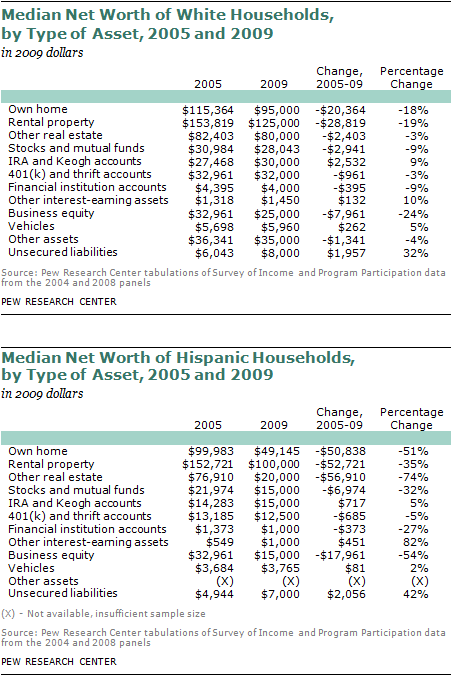
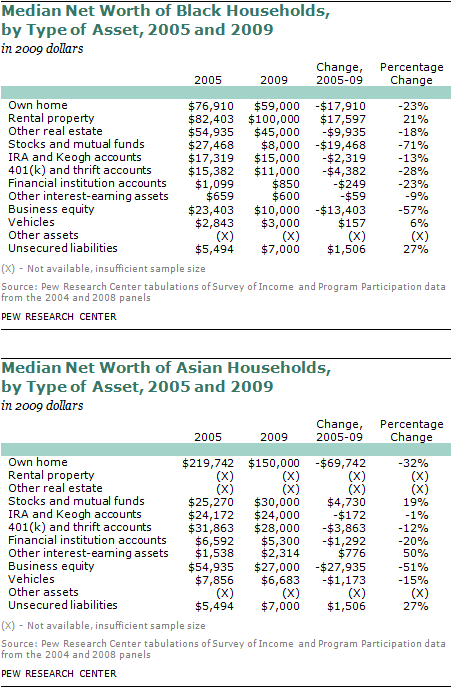
Homeowners—65% of all U.S. householders in 2009—experienced a sharp decline in home equity from 2005 to 2009. The greatest losses were felt by Hispanic and Asian homeowners. For Hispanics, the median level of home equity fell by half (51%), from $99,983 in 2005 to $49,145 in 2009. Median home equity for Asian homeowners dropped from $219,742 in 2005 to $150,000 in 2009, a loss of 32%.
Losses for black and white homeowners were less severe. Black homeowners lost 23% of their home equity, from $76,910 in 2005 to $59,000 in 2009. Median home equity for white homeowners eroded 18%, from $115,364 to $95,000.
The median value of directly held stock and mutual funds declined the most for Hispanics and blacks. Hispanics who owned stocks and mutual funds lost 32% of their value, down from $21,974 in 2005 to $15,000 in 2009. Losses for black stockholders were more than twice as high. Their holdings of stock and mutual funds fell from $27,468 in 2005 to $8,000 in 2009, a loss of 71%.
The median value of stocks and mutual funds owned by whites dropped modestly, falling 9% from $30,984 in 2005. Stocks and mutual funds owned by Asians actually increased in value, rising 19% from $25,270 in 2005 to $30,000 in 2009.

Retirement plans are also an important source of wealth accumulation for households. Black householders experienced significant losses in their pension savings. The value of IRA and Keogh accounts held by black householders fell from $17,319 in 2005 to $15,000 in 2009, a drop of 13%. Likewise, the value of their 401(k) and thrift accounts shrank from $15,382 to $11,000, a loss of 28%.
Hispanic and white households with pension savings experienced relative stability in their IRA, Keogh, 401(k) and thrift accounts. For both groups, the median value of IRA and Keogh accounts increased modestly from 2005 to 2009 and the median value of 401(k) and thrift accounts decreased slightly. Asian households experienced a 12% decline in the value of their 401(k) and thrift accounts and little change in their IRA and Keogh accounts.

In light of the economic downturn, it is notable that business owners, regardless of race and ethnicity, reported large losses in the equity they hold in their businesses. The loss in business equity was highest among minority households, all losing about half the value they started with in 2005. For Hispanics, business equity fell
from $32,961 in 2005 to $15,000 in 2009; for blacks, equity in their businesses decreased from $23,403 to $10,000; and, for Asians, business equity dropped from
$54,935 to $27,000. White households experienced a loss of 24%, the median equity in their business falling from $32,961 in 2005 to $25,000 in 2009.
Even as the net value of most assets was on the decline, the unsecured liabilities of households (credit card debt, education loans and other loans not secured by assets) were on the rise from 2005 to 2009. The increase was greatest for Hispanics, their unsecured debt growing from $4,994 in 2005 to $7,000 in 2009, or by 42%. White households have higher levels of unsecured debt, $6,043 in 2005 and $8,000 in 2009. However, the increase for them, 32%, was not as great as for Hispanics. Blacks and Asians have identical levels of unsecured liabilities, and the median values for them rose the least, from $5,494 to $7,000, or by 27%.


