About the Veterans Survey
Veterans of the U.S. armed forces constitute a somewhat rare population, especially those who served after the terrorist attacks of Sept. 11, 2001. Military veterans are an estimated 9.6% of the U.S. adult population, and those who served after 9/11 account for 12% of all veterans (and thus slightly more than 1% of the adult U.S. population). No publicly available comprehensive list of veterans exists to provide the basis for a sampling frame. Because veterans are widely dispersed among the general public, sampling methods used for certain rare populations that tend to be geographically concentrated are not very effective in improving the efficiency of locating and interviewing this group. Thus, extensive screening using several different sampling sources was necessary to interview this population.
This study interviewed a representative sample of 1,853 veterans who served in the U.S. armed forces and are no longer on active duty. Interviewing was conducted between July 28 and Sept. 4, 2011. Of the total sample of 1,853 veterans, 1,134 had separated from military service before 9/11 (“pre-9/11 veterans”) and 712 served after 9/11 (“post-9/11 veterans”), including 336 who served in Afghanistan or Iraq since combat operations began in those countries. The time of service of seven respondents was not determined.
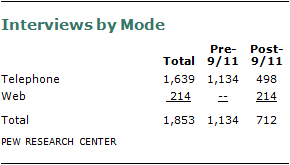
Sampling, data collection and survey weighting were conducted or coordinated by Social Science Research Solutions (SSRS). Several sample sources were employed in order to ensure an adequate number of interviews with post-9/11 veterans. Most of the interviews (n=1,639, including 498 interviews with post-9/11 veterans) were obtained from random digit dialing (RDD) studies conducted by SSRS and the Pew Research Center. A total of 1,307 interviews were conducted on landline telephones and 332 on cell phones. An additional 214 interviews were conducted with post-9/11 veterans through the random sample panel of households maintained by Knowledge Networks between Aug. 18 and Aug. 31, 2011. This chapter describes the design of the sample and the methods used to collect and weight the data.
I. Sample Design
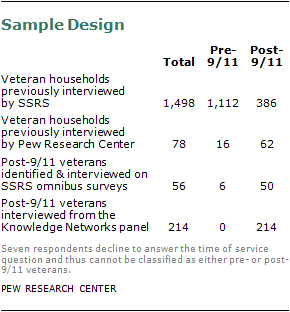
The majority of survey respondents were recruited in a two-stage sampling process. The first stage involved screening for qualifying veteran households and respondents (prescreening), and the second involved the actual administration of the survey. A small portion of the post-9/11 veterans (n=56) were interviewed during SSRS’s omnibus survey without a prescreening stage. An additional 214 post-9/11 veterans recruited from Knowledge Networks completed an online interview without a prescreening stage.
Screening by SSRS
Questions to identify households with military veterans were included on SSRS national surveys starting March 2, 2011, and running through Sept. 4, 2011. These studies employed a random based sampling procedure.31 Prescreening involved three questions:
1. Have you or has anyone in your household ever served in the U.S. military or the military reserves?
2. Did you or that person serve in the military or military reserves since Sept. 11, 2001?
3. Did you or that person serve in Iraq or Afghanistan since Sept. 11, 2001?
The initial sample derived from these prescreening interviews included all numbers where a respondent indicated there was a veteran in the household (whether or not this was the original respondent).
To boost the share of post-9/11 veterans in the survey, additional sample based on four surveys conducted in 2011 was provided by the Pew Research Center, which resulted in 78 interviews with respondents who served personally or who reported that another household member had done so.32 Only the first two SSRS screening questions used to identify veteran households were asked on two of the Pew Research surveys while all three questions were asked on two others.
Members of the Knowledge Networks panel were randomly recruited for the survey and were first asked an initial screener question to determine whether they served in the military after Sept. 11, 2001. Those who answered yes to this question were then asked to complete the remainder of the survey.
Main survey
The RDD telephone sample for the survey was drawn from the pool of prescreened sample from SSRS and the Pew Research Center. The sample was divided into two groups based on whether a pre-9/11 or post-9/11 veteran was reported to be living in the household. Below is the overall breakdown of the final interviews, based on sample source and time of service.
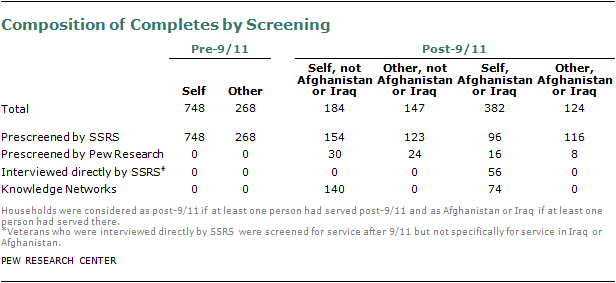
The prescreened sample included more pre-9/11 veteran households than needed, so a random sample of 3,673 pre-9/11 veteran households was drawn for the survey. All prescreened post-9/11 households (n=2,416) were included in the post-9/11 sample.
Additional steps were taken in order to assure the highest possible rate of response among post-9/11 veterans, including:
(1) A $20 incentive was offered to all respondents in the post-9/11 sample who initially refused to participate in the survey, and starting July 22, 2011, this incentive was offered to all post-9/11 veterans in the sample.
(2) Phone numbers of the post-9/11 sample were crossed with records in the infoUSA and Experian databases in order to match as many of these phone numbers as possible with addresses. For sampled phone numbers with an address match, an advance letter was sent to this household, along with a $2 incentive. The letter informed potential respondents of the study and its importance, offering them a toll-free number to dial in to participate and advising them of the pre-incentive. For a total 1,097 cases (57.2%), phone numbers were matched to addresses and were mailed a letter. An additional 420 interviews drawn from an address-based screening study also received a letter. In all, 256 interviews were completed with respondents in these households (16.9% of the total households where addresses were matched).33
(3) In cases where respondents at the re-contacted numbers said the veteran in their household could be reached at a different phone number, the new number was substituted and used to attempt to reach the respondent.
Interviews with respondents in SSRS’s omnibus survey
Additional interviews with post-9/11 veterans (n=56) were conducted directly on SSRS’s Excel omnibus survey. Starting July 29, Excel respondents who reported personally serving in the armed forces after 9/11 were interviewed at the time of contact, rather than being screened and re-contacted.
Excel is a national, weekly, dual-frame bilingual telephone survey designed to meet standards of quality associated with custom research studies. Each weekly wave of Excel consists of 1,000 interviews, of which 300 are obtained with respondents on their cell phones and a minimum of
30 interviews are completed in Spanish. All Excel data are weighted to represent the target population, based on parameters from the Current Population Survey (CPS).
Knowledge Networks Panel
An additional 214 interviews were c0nducted with post-9/11 veterans who are members of Knowledge Networks’ online panel, using an online version of the questionnaire. Knowledge Networks (KN) is an online research panel designed so that it is representative of the entire U.S. population. KN now recruits households using address-based sampling methods, and thus includes cell phone-only households, although some existing panel members were originally recruited using landline RDD. Households who have opted into the panel are contacted either by email or through an online member page with requests to take a survey.34
Data from KN are given a base weight to correct for deviations from random selection to the panel, such as under-sampling of telephone numbers unmatched to a valid mailing address, over-sampling in certain geographic regions, and disproportionate recruitment of those living at addresses that could be matched to a landline phone number. KN also post-stratifies to parameters from the CPS in order to control for non-response and non-coverage at both the level of the panel and the individual survey.
II. Data Collection and Processing
The questionnaire was developed by Pew Research Center staff in consultation with the SSRS project team. The questionnaire was also available in Spanish so respondents could choose to be interviewed in English or Spanish, or switch between the languages according to their comfort level.
Two pretests of the survey instrument and procedures were conducted on July 8-9 (pre-9/11 veterans) and July 14-15 (post-9/11 veterans). In view of the scarcity of post-9/11 sample, the post-9/11 sample used for the pretest was a convenience sample provided by the Pew Research Center. Members of the Pew Research project team listened to recordings of the pretest interviews, and the questionnaire was adapted according to the pretest findings.
In order to maximize survey response, SSRS used the following procedures during the field period:
- Each non-responsive number that had not already set up a callback appointment for an interview (largely voice mail, no answers and busy) was called approximately eight additional times, varying the times of day and the days of the week.
- Interviewers left messages on answering machines with a callback number for the respondent to call in and complete the survey.
- The study included an incentive of $5 for cell phone respondents in the pre-9/11 veteran group.
Screening
Although all of the households in the pre-screened sample had indicated the presence of a veteran, it was necessary to re-screen the household at the time of the second contact. The screening protocol was distinguished by the type of veteran in the household (pre-9/11, post-9/11 but not in Afghanistan or Iraq, or post-9/11 in Afghanistan or Iraq) and by phone type (landline or cell phone). If the prescreen indicated that an Afghanistan or Iraq veteran lived in the household, the interview would begin by asking to speak with that veteran (and if there was more than one post-9/11 Afghanistan or Iraq veteran in the household, interviewers asked to speak with the one who had the most recent birthday). If the respondent said no such person was available, interviewers asked for a veteran who served at any time since Sept. 11, 2001. If no person met that definition, interviewers asked to speak with any veteran living in that household. A similar hierarchy of questions was used if the prescreen suggested a post-9/11 non-Afghanistan or Iraq veteran lived in the household (without asking for an Afghanistan or Iraq veteran). Where only a pre-9/11 veteran was mentioned in the pre-screen, interviewers simply asked to speak with a veteran living in that household.
Although cell phones are typically considered individual, rather than household, devices, the cell phone screener was essentially identical to the landline screener. This is due to the fact that the pre-screen interviews asked about “someone in the household” in general and there was no guarantee that person would be answering the cell phone. The one difference was that if the respondent confirmed the presence of the type of veteran asked about, interviewers would ask whether the respondent or someone else was the veteran.
Screen-Outs
Once the selected veteran was on the phone, two more questions about eligibility were asked before the main interview began.
1. Active-duty status. Individuals who are still on active duty were not eligible for the study, and thus a question was asked to determine the duty status of the selected respondent. Altogether, 198 respondents reported that they were still on active duty. This situation arose most often in the post-9/11 sample and specifically, where “someone else” was the reported veteran in the household (n=142). Interviews in 204 households were coded as ineligible because the veteran living in these households was reported to be on active duty (of which, 200 were in the post-9/11 sample).
2. State-level National Guard service. Eleven respondents whose experience in the armed forces consisted exclusively of being called up by the governor for National Guard service (Title 32) were screened out of the interview as well (an additional five respondents refused to answer this question).
Veteran Status
In total, 1,016 interviews were completed with respondents from the pre-9/11 re-contact sample; based on their responses, 990 were pre-9/11 veterans and 20 were post-9/11 veterans (seven of these served in Afghanistan or Iraq). And 567 interviews were completed with respondents from the post-9/11 re-contact sample; based on their responses, 428 were post-9/11 veterans (223 of these served in Afghanistan or Iraq) and 138 were pre-9/11 veterans.
III. Analysis of Mode Differences
Previous research has shown the mode of survey interview can sometimes affect the way in which questions are answered, especially for sensitive questions. Because the post-9/11 veterans were interviewed using both telephone (n=498) and internet (n=214) modes, we analyzed whether there were differences between the two samples to ensure that the data from the two modes were comparable enough to be combined. Variations can arise from both the mode of interview and from differences in the two samples used for the interviews. It is necessary to attempt to disentangle sample and mode differences to understand what may be causing any variations.
The web questionnaire mirrored the phone questionnaire as much as possible. However, some differences may result because of how the questions were asked in the two modes when the formats could not be exactly the same (for example, volunteered responses on the phone, such as “other” or “depends,” were not offered on the web).
In general, the differences in responses between the two modes were modest in size and most were not statistically significant. For many of the key questions in the survey, including those of a sensitive nature, there were no significant differences between the post-9/11 veterans who responded by phone and those who responded by web. There were no significant differences on ratings of their overall health, whether they were seriously injured while performing their duties, or whether they had experienced post-traumatic stress, depression, anger or strained family relations as a result of their military service. Similarly, no significant differences were found for ratings of Obama’s job performance as commander in chief, whether the wars in Afghanistan and Iraq have been worth fighting or basic evaluations of the U.S. military. There also were no significant differences by mode on questions about various aspects of their military service, including the length of their service, whether they had served in Afghanistan or Iraq, whether they had served in combat or a war zone, or the number of times they had been deployed.
There were statistically significant differences in 19 of the 60 substantive questions, but in general the pattern was not consistent. More web than phone post-9/11 veterans said it is best for the country to be active in world affairs (45% vs. 31%) and that the increased use of drone attacks is a good thing (93% vs. 84%). More phone than web respondents said it was appropriate for the military to be involved in nation building (63% vs. 50%) and that someone who they knew and served with was killed while performing their duties in the military (52% vs. 37%). Phone respondents were more critical than web respondents of the care that injured military personnel received in military hospitals in the U.S. (26% only fair or poor job, compared with 13% of web respondents).
On two questions that asked about a list of items, post-9/11 veterans who responded by phone were more likely than those who responded by web to say their military service had a positive effect on various aspects of their life. More phone respondents said their military service was very useful in teaching them to work together with others, giving them self-confidence, preparing them for a job or career, and helping them grow and mature as a person. Similarly, phone respondents were more likely than web respondents to say that they appreciated life more, felt proud of their military service and had people thank them for their service. Phone respondents also were more satisfied than web respondents with their personal financial situation.
The samples of post-9/11 veterans who responded by phone and those who responded online were somewhat different on a few characteristics. There were no significant differences by gender, age, race or ethnicity, but more phone than web respondents had never attended college and fewer were currently married. To analyze whether the differences by mode were related to any of these demographic differences, we ran logistic regression models for each of the questions that exhibited significant differences by mode controlling for standard demographics (gender, age, race/ethnicity, education, marital status and for some questions party identification) as well as factors related to their military service (whether an officer or not, years of service, whether served in Iraq or Afghanistan, and number of deployments). After controlling for all these variables, a significant effect by mode of interview was found for six of the 19 questions, including whether it is best for the U.S. to be active in world affairs, satisfaction with their personal finances and how good the care is for injured veterans at U.S. military hospitals. A significant difference by mode also was found for whether the military helped them learn to work together with others, helped them grow and mature, and whether people had thanked them for their military service.
Because there was not a consistent pattern across these differences, we made the decision to combine the phone and web samples for the analysis of post-9/11 veterans in the report.
IV. Weighting Procedures
A two-stage weighting design was applied to ensure an accurate representation of the pre-9/11 and post-9/11 veteran population. The first stage (the base or design weight phase) included four steps.
First stage
1. Re-contact propensity correction
An adjustment to account for the potential bias associated with re-contacting respondents (sample bias). This is a typical problem for panel studies, where bias is introduced if certain types of respondents in the original study (in this case the prescreened veterans) have a different likelihood of being available for or amenable to a follow-up survey.
Inverse Probability Weighting (IPW) or Propensity Weighting is typically used to adjust for attrition in panel and longitudinal studies. Characteristics of the respondents as measured in the initial studies were used to model their probability of response to the re-contact survey. This was done with a logistic regression model in which the outcome is whether or not a screened household produced a completed re-contact interview. The initial studies varied somewhat in the demographic questions available for the modeling. Consequently, slightly different models were used for each subsample source. Variables in these models included demographics such as gender, age, race, education, marital status, presence of children in the household, geographic variables such as Census Bureau region or metropolitan status and phone status (e.g., cell phone only and landline only). For the subsamples from SSRS studies, separate regressions were used to predict completion of the re-contact interview by those who screened in as pre-9/11 and post-9/11 veterans. Predictors with a p-value greater than .30 were dropped from the logistic regression models.
The predictive values are used as the probability of a person being a respondent to the re-contact survey. The inverse of this probability is computed and used as the propensity weight. As such, higher weights correspond to respondents who have a lower probability of responding to the re-contact survey. Therefore, if, for example, people with high educational attainment were more likely to respond to the re-contact, such cases would attain a lower propensity weight and respondents with low educational attainment would receive a higher weight.
In order to account for any biases in the original surveys from which the re-contact cases were drawn, the weights derived for those studies were applied prior to the propensity-weighting process. Interviews completed on the omnibus survey assigned only their unique weight within the omnibus survey at this stage. The Knowledge Networks sample was assigned the weighting correction provided by KN at this point (which includes a correction for that particular panel design).
2. Correction for listed-sample overrepresentation
One of the sample modifications included the mailing of invitations and pre-incentives to post-9/11 sample cases in the RDD frame whose phone numbers were matched with a mailing address in published directories. This increased the relative likelihood of completing interviews with matched (listed) post-9/11 interviews. To correct for any possible bias caused by the mailing, a weight was calculated as the quotient of MS/MD for the listed cases and US/UD for the unlisted cases, where MS and MD stand for the share of matched records in the sample and in the data respectively, and US and UD stand for the share of unmatched records in the sample and in the data respectively. The KN data and cases interviewed directly on the omnibus survey received a weight of 1 at this stage.
3. Within household selection correction
The purpose of this stage was to correct for the unequal probabilities that are introduced by some households having more qualified veterans than others. Qualification was affected by the type of veteran screened at the beginning of the interview. If the veteran was screened in by requesting to speak with the veteran who served in Afghanistan or Iraq, the qualifying respondents would be those living in that household and had served in these areas. If the screening was for veterans who served at some point since 9/11, all veterans in the household who served during this period were considered the qualifying veterans. And if the screener asked simply to speak with a veteran living in the household, all veterans in the household were qualifying respondents.
Households with a single qualifying veteran received a weight of 1, households with two qualifying veterans received a weight of 2, and households with three or more qualifying veterans received a weight of 3. Respondents with missing data were given the mean response. Cases were adjusted so that the sum of this weight totaled the unweighted sample size.
These three corrections (propensity-to-complete, listed-sample overrepresentation and within household probability of selection) were multiplied together to arrive at a final base weight. Base-weights were truncated at the top and bottom 2.5%.
Second stage
The second stage of weighting was the post-stratification sample balancing. We utilized an iterative proportionate fitting (IPF) procedure to create the post-stratification weights. IPF, or “raking,” is a now-ubiquitous sample balancing method designed to adjust samples in economic and social surveys on selected demographic characteristics using parameters obtained from credible sources such as the U.S. Census Bureau. IPF uses least-squares curve fitting algorithms to obtain a unique weight for each case that minimizes the root mean square error (RMSE) across multiple dimensions simultaneously. It then applies these weights to the data and repeats the procedure using the newly obtained marginal counts to obtain yet another set of weights. This process is repeated for a specified number of iterations or until the difference in the RMSE between successive steps becomes less than a specific minimum value. This study employed an IPF procedure using statistical software that also allows for the application of a pre-existing base weight to the input data for the sample balancing process.
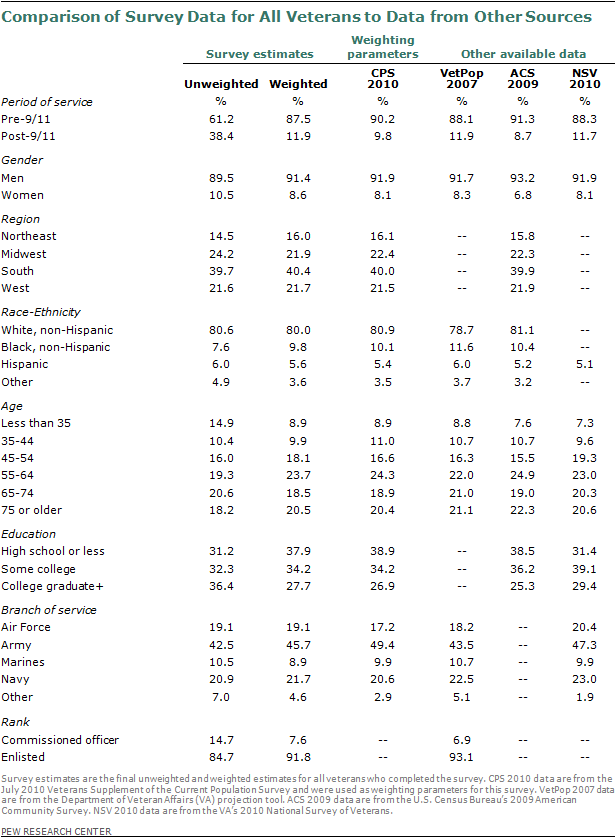
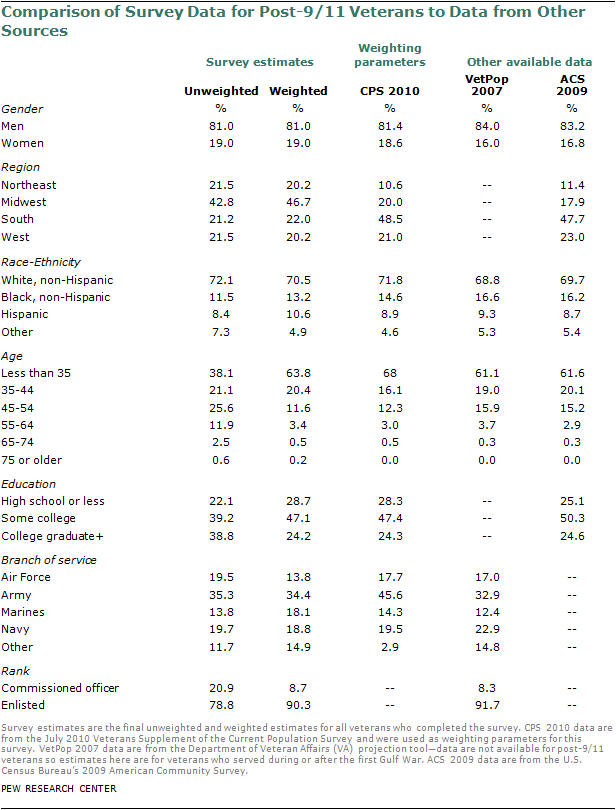
The pre-9/11 and post-9/11 groups were weighted, separately, to match the July 2010 CPS figures for age, gender, ethnicity, educational attainment, census region and metropolitan status, for each group. Because the pre-9/11 and post-9/11 samples were weighted separately, population parameters for each of these groups needed to be established. There are several sources providing demographic details about veterans, including the U.S. Census Bureau’s Current Population Survey (CPS) and the American Community Survey (ACS). Specifically, the Census Bureau conducts a recurring survey focused on veterans asking more extensive questions that allow distinguishing type of service, combat service and military branch.
Both Census surveys have limitations. For one, they are currently a year (CPS) to two years (ACS) old. Typically, this is not a major concern because demographics are slow-shifting. However, some parameters among the veteran population are shifting more rapidly. The number of post-9/11 veterans is constantly growing, since each new recruit, by definition, is already or will become a post-9/11 veteran. At the same time the aging pre-9/11 population is naturally decreasing in size. Accordingly, the mean age of the pre-9/11 veteran group is increasing. Some projection of group sizes and their age distribution is necessary.
Furthermore, the size of the post-9/11 veterans is relatively small. In the sample sources used for estimating the characteristics of this group, some of the post-9/11 samples included approximately 600 cases (CPS, July 2010). In other words, the Census sources were limited due to their size and age.
An alternative source is the VetPop 2007 tool of the Department of Veteran Affairs (VA). VetPop involves projections of the veteran population (through 2036) based on the 2000 Decennial data, other Census data (ongoing updates) and official Department of Defense accounts about recruitment, deaths and separations. These projections are not the same as Census counts, but instead build on existing information to produce accurate estimates of the veteran population. In the VA’s most recent National Survey of Veterans (NSV), survey data were post-stratified to projected counts from VetPop 2007.
Acknowledging the limitations of each of the available sources of information about demographic parameters for these veteran groups, comparisons among multiple sources (ACS, CPS, VetPop, NSV) were made to determine the most plausible estimate of the key demographic parameters. Because the differences among these sources were minor, the July 2010 CPS figures were used (see tables at the end of this section for detailed comparisons).
In addition to demographic characteristics such as age, sex and education, an estimate of telephone status was needed. With the increase of wireless-only households, the veterans survey may have been at risk of under-covering veterans who answer only cell phones (and, indeed, most of the prescreening surveys had underrepresented cell phone-only households by design). This was a particular concern with the post-9/11 veteran group, which is younger and, as such, more likely to live in wireless-only households. An overall estimate of the wireless-only veteran population was derived from the 2010 National Health Interview Survey (NHIS). According to NHIS, 19% of veterans lived in wireless-only households. It was not possible to create separate estimates for phone status of pre-9/11 and post-9/11 veterans directly from the NHIS data. An estimate was creating using observed distributions from the dual frame Excel omnibus. Post-9/11 veterans in the weighted Excel file had a wireless-only rate that was nearly three times as large as the pre-9/11 veterans. On this basis, it was estimated that 16.3% of pre-9/11 veterans and 46.0% of post-9/11 veterans were wireless-only.
Design Effects
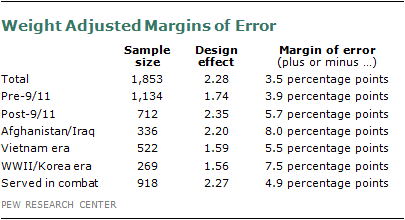
Weighting procedures increase the variance in the data, with larger weights causing greater variance, and, as a consequence, a higher margin of error for given sample size. The impact of the survey design on variance estimates is measured by the design effect. The design effect describes the variance of the sample estimate for the survey relative to the variance of an estimate based on a hypothetical simple random sample of the same size. In situations where statistical software packages assume a simple random sample, the adjusted standard error of a statistic should be calculated by multiplying by the square root of the design effect. Each variable will have its own design effect. The following table shows the sample sizes, design effects and the error attributable to sampling that would be expected at the 95% level of confidence for different groups in the survey:
V. Response Rate
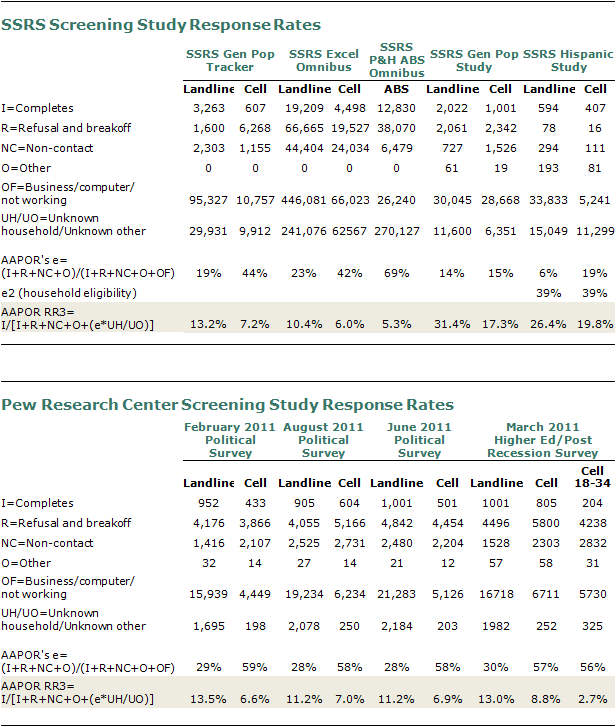
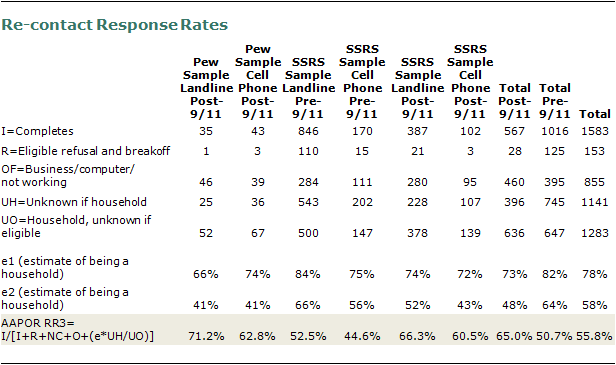
The overall response rate for this study was calculated to be 5.8% using AAPOR’s RR3 formula modified to account for screening in screener surveys, and by combining the final response rates of the screening studies and the re-contact study. The re-contact rate response rate was 55.8% (the re-contact rate refers to the response rate among the prescreened cases, who were asked to complete the veterans survey), and the original screening response rate was 10.3%.
Re-contact Screening Response Rates Generally, screener surveys are different than general population surveys in that there are two levels of eligibility: household and screener. That is, a sample record is “household eligible” if it is determined that the record reaches a household. Screener eligible refers to whether known household-eligible records are eligible to in fact complete the full survey. In the case of the veterans survey, screener eligibility refers to whether a household has a member who has served in the military but is not currently on active duty.
The standard AAPOR RR3 formula is as follows:

Where: I: Completed Interview R: Known Eligible Refusal/ Breakoff NR: Known Eligible Non-Respondent UNR: Unknown if Household UR: Household, Unknown if Screener Eligible e = Estimated Percent of Eligibility
At issue with this calculation for screener surveys is that it does not distinguish the two separate eligibility requirements: UNR and UR and both multiplied by an overall “e” that incorporates any and all eligibility criteria. An alternative RR4 calculation utilized by a large number of health researchers and academicians simply divides “e” into two separate numbers, one for household eligibility and one for screener eligibility:

Where: e2 = Estimated Percent of Household Eligibility e1 = Estimated Percent of Screener Eligibility
“E” calculations are completed via the standard “proportional representation” method dictated by AAPOR. In short, e2 is all identified household / (all identified households + all identified non-households) and e1 = all identified households eligible to do the full survey / (all identified households known to be eligible to do the full survey + all identified households know to not be eligible to do the full survey). See Appendix for a full disposition of the re-contact sample.
With regard to the original screening sample, response rates were calculated using the AAPOR RR3 formula provided above, with the exception of one SSRS study of Hispanics, because that study is also a screening study rather than a general population study.
Knowledge Networks
Interviews attained from Knowledge Networks presented a special case. In general, Knowledge Networks provides a quite different method for calculating response rates, given the unique nature of its sample. Below are the components of the response rate calculation and the actual calculations. An extended description of how to compute response metrics for online panels is found in Callegaro & DiSogra (2008).
Household Recruitment Rate (RECR) = .174 Panel recruitment is done using RDD telephone methods and address-based sampling (ABS). The recruitment rate is computed using the AAPOR Response Rate 3 (RR3). If at least one member of the household is recruited, the household as a unit is counted in the household recruitment rate.
Household Profile Rate (PROR) = .619 The study profile rate is computed as an average of the cohort profile rates for all households in the study sample. Although the average number of profiled panel members per household is usually greater than one, a household is considered “profiled” when at least one member completes a profile survey. In this study, an overall mean of 61.9% of recruited households successfully completed a profile survey.
Study Completion Rate (COMR) = .852 For this study, one panel member per household was selected at random to be part of the sample. At the end of the fielding period, 85.2% of assigned members completed the survey. Substitution, or another member of the same household taking the survey instead of the sampled respondent, was not allowed in this study. This is also the general policy for Knowledge Networks panel samples.
Break-Off Rate (BOR) = .003 Among all members who started the survey, 0.3% broke off before the interview was completed. It is the researcher’s call to classify break-off as break-offs or partial interviews depending on the study design and the key variables to be measured.
Household Retention Rate (RETR) = .316 The retention rate is computed as an average of the cohort retention rates for all members in the study sample.
Cumulative Response Rate 1 (CUMRR1) = RECR * PROR * COMR = .092 Because one member per household was selected in computing the cumulative response rate, we use the household recruitment rate multiplied by the household profile rate and the survey completion rate.
Cumulative Response Rate 2 (CUMRR2) = RECR * PROR * RETR * COMR = .029 In the cumulative response rate 2, retention is taken into account.
In short, 3,910 panelists who previously reported serving in the military were drawn from the Knowledge Networks panel; 3,332 responded to the invitation, yielding a final stage completion rate of 85.2% percent. The recruitment rate for this study was 17.4% and the profile rate was 61.9%, for a cumulative response rate of 9.2%.
Given the diverse sample sources utilized for the study a final overall screening rate for the veterans survey can be calculated in raw form, because three distinct metrics are used. Therefore, a final screening response rate was developed as a basic weighted average of the component response rates. That is, the final screening response rate is based on the response rate of each distinct screening source, weighted to the percent of sample each screening source afforded to the final screening sample database.
A summary of each screening dataset response rate is provided below.
Tables
About the General Public Survey
Results for the general public survey are based on telephone interviews conducted Sept. 1-15, 2011, among a national sample of 2,003 adults 18 years of age or older living in the continental United States (a total of 1,203 respondents were interviewed on a landline telephone, and 800 were interviewed on a cell phone, including 349 who had no landline telephone). The survey was conducted by interviewers at Princeton Data Source under the direction of Princeton Survey Research Associates International (PSRAI). Interviews were conducted in English and Spanish. A combination of landline and cell phone random digit dial (RDD) samples were used; both samples were provided by Survey Sampling International. The landline RDD sample was drawn using traditional list-assisted methods where telephone numbers were drawn with equal probabilities from all active blocks in the continental U.S. The cell sample was drawn through a systematic sampling from dedicated wireless 100-blocks and shared service 100-blocks with no directory-listed landline numbers.
Both the landline and cell samples were released for interviewing in replicates, which are small random samples of each larger sample. Using replicates to control the release of telephone numbers ensures that the complete call procedures are followed for all numbers dialed. At least 7 attempts were made to complete an interview at every sampled telephone number. The calls are staggered over times of day and days of the week (including at least one daytime call) to maximize the chances of making contact with a potential respondent. An effort is made to re-contact most interview breakoffs and refusals to attempt to convert them to completed interviews.
Respondents in the landline sample were selected by randomly asking for the youngest adult male or female who is now at home. Interviews in the cell sample were conducted with the person who answered the phone, if that person was an adult 18 years of age or older.
Weighting is generally used in survey analysis to adjust for effects of sample design and to compensate for patterns of nonresponse that might bias results. Weighting also balances sample demographic distributions to match known population parameters. The weighting was accomplished in multiple stages.
The first stage of weighting included a probability-of-selection adjustment for the RDD landline sample to correct for the fact that respondents in the landline sample have different probabilities of being sampled depending on how many adults live in the household (i.e., people who live with no other adults have a greater chance of being selected than those who live in multiple-adult households). This weighting also accounted for the overlap in the landline and cellular RDD frames.
In the second stage of weighting, the combined sample was weighted using an iterative technique that matches gender, age, education, race, Hispanic origin and region to parameters from the March 2010 Census Bureau’s Current Population Survey. The population density parameter is county-based and was derived from 2000 Census data. The sample also is weighted to match current patterns of telephone status and relative usage of landline and cell phones (for those with both), based on extrapolations from the 2010 National Health Interview Survey.
The survey’s margin of error is the largest 95% confidence interval for any estimated proportion based on the total sample—the one around 50%. The margin of error for the entire sample is plus or minus 2.5 percentage points. This means that in 95 out of every 100 samples drawn using the same methods, estimated proportions based on the entire sample will be no more than 2.5 percentage points away from their true values in the population. Sampling errors and statistical tests of significance take into account the effect of weighting. Sample sizes and sampling errors for subgroups within the full sample are available upon request.
In addition to sampling error, one should bear in mind that question wording and practical difficulties in conducting opinion surveys can introduce error or bias into the findings.


