As Americans navigate increasingly crowded lives, the number of things they say they can’t live without has multiplied in the past decade, according to a new Pew Research Center survey that asks whether a broad array of everyday consumer products are luxuries or necessities.
Some of these goods, such as home computers, are relatively recent information era innovations that have been rapidly transformed in the public’s eyes from luxury toward necessity.
But other items – such as microwave ovens, dishwashers, air conditioning for the home and car, and clothes dryers – have also made substantial leaps in the past decade even though they’ve been fixtures on the consumer landscape for far longer.
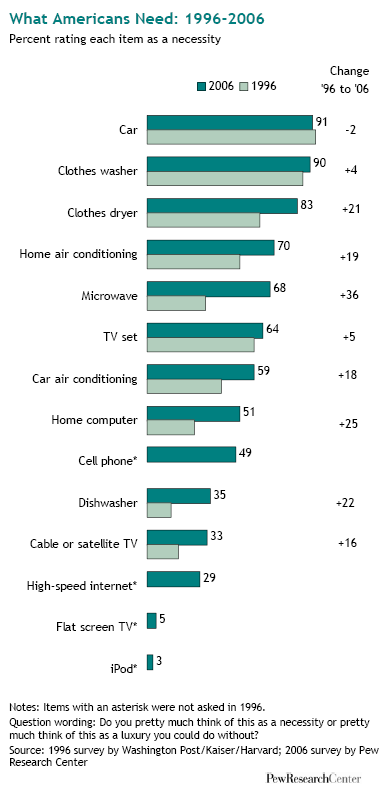
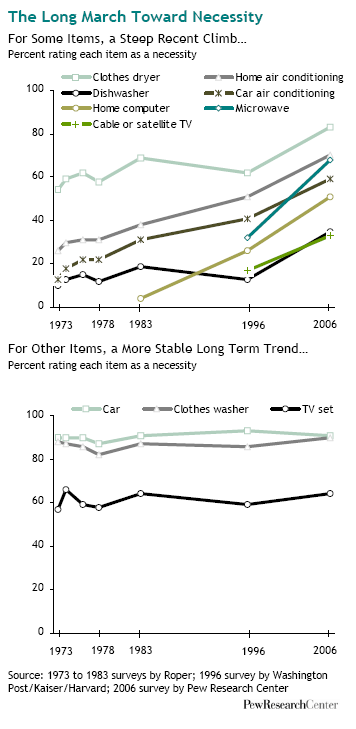
For example, the percentage of American adults who describe microwave ovens as a necessity rather than a luxury has more than doubled in the past decade, to 68%. Home air conditioning is now considered a necessity by seven-in-ten adults, up from half (51%) in 1996. And more than eight-in-ten (83%) now think of a clothes dryer as a necessity, up from six-in-ten (62%) who said the same a decade ago in a survey conducted by the Washington Post, the Henry J. Kaiser Family Foundation, and Harvard University.
The Pew survey asked the “Luxury or Necessity?” question about 14 different consumer products designed to help make everyday life more productive, more convenient, more comfortable, more efficient or more entertaining. It was conducted by telephone from October 18 through November 9, 2006 among a randomly-selected nationally-representative sample of 2,000 adults.
Survey respondents placed the 14 items on a very broad range along the “necessity” scale — with a high of 91% describing a car as a necessity and a low of 3% saying the same about an iPod.

But one pattern was consistent: wherever there has been a significant change in the past decade in the public’s judgment about these items, it’s always been in the direction of necessity. And on those items for which there are longer term survey trends dating back to 1973, this march toward necessity has tended to accelerate in the past ten years.
The two most ubiquitous products of the information era – home computers and cell phones – are currently situated in the middle of the pack, with the public evenly divided about their status. Computers are deemed a necessity by 51% of the adult public, and cell phones by 49%.
But both of these products are making a swift climb up the necessity scale. A decade ago, just 26% of adults considered the home computer a necessity, and back in 1983, when computers were still a novelty, just 4% felt that way. Meantime, cell phones were still so exotic in 1996 that they weren’t even placed on the survey. The same holds for high-speed internet access; it didn’t exist as a consumer service in 1996, but it’s now considered a necessity by 29% of the adult public.
The old adage proclaims that “necessity is the mother of invention.” These findings serve as a reminder that the opposite is also true: invention is the mother of necessity. Throughout human history, from the wheel to the computer, previously unimaginable inventions have created their own demand, and eventually their own need. But you don’t have to take our word for it — just ask the American public.
Age

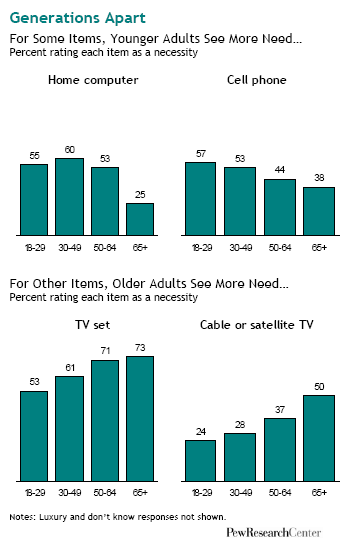
The Pew survey finds that people of different ages often make these luxury-or-necessity calculations through different lenses. But the pattern varies. For some items (mainly information era technologies), it’s the younger respondents who are more prone to see a necessity. In other cases (mainly home appliances that offer convenience, comfort and entertainment), it’s the older respondents more inclined to see a necessity.
For example, more than twice as many younger adults (ages 18 to 29) than older adults (65 and over) consider home computers and high-speed internet access a necessity. (However, among those who use the internet, these age differences largely disappear.)
Also, more younger than older adults say that cell phones are a necessity.
On the other hand, more older adults than younger adults consider home and car air conditioning, dishwashers and clothes washers and dryers to be a necessity. The same holds for television sets and for cable or satellite television services; older adults are more prone to see these, too, as necessities.
Not so, however, for two of the more recent entertainment product innovations – flat screen, plasma or high definition televisions and iPods. Here, the “necessity” skew is in the direction of younger adults, even though only a relative few (8%) of 18 to 29 years olds view these goods as necessities. (At least for now.)
Finally, there are a couple of items – a car and a microwave – for which age makes little or no difference in these assessments.
The views of those in the middle age groups (ages 30 to 49 and 50 to 64) are similar to those of their youngers (ages 18 to 29) on some of the items and more like those of their elders (ages 65 and older) for others. But when it comes to age, the overall findings tend to confirm what the philosophers and poets have observed through the millennia — life unfolds in phases, each with its own menu of wants, desires and needs.
However, as public attitudes on these luxury-or-necessity questions have migrated toward “necessity” in the past decade, for most items these changes have taken place at a similar pace among all age groups. One exception, has to do with views about the television. An identical percentage of 18-to-29 year olds now as in 1996 (53%) describe the television as a necessity. But among those over age 65, somewhat more respondents now (73%) than in 1996 (65%) say the TV is a necessity.
Income
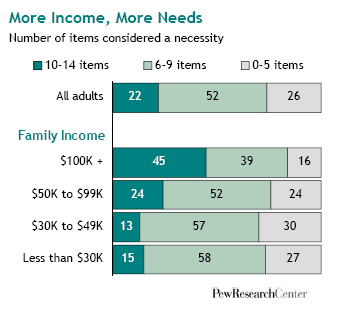
When it comes to income levels, the story is different. Here, the pattern tends to play out in one direction only: the more income a person has, the more likely he or she is to view goods and gadgets as necessities rather than luxuries.
However, the degree of variance varies. For some items, it is fairly significant and for others it is minor or non-existent.
Income makes a big difference when it comes to three information era items – home computers, high-speed internet access and cell phones. It also has an effect on attitudes toward one old warhorse of a home appliance – the dishwasher; and on one creature comfort – the car air conditioner.

It makes a smaller difference for cars and for clothes washers and dryers.
And it makes virtually no difference for a mixed bag of items, including home air conditioning, a microwave, and a battery of entertainment products, including a television, high definition television, satellite and cable TV services, and an iPod.
Overall, some 45% of adults with family incomes of $100,000 and above rate at least 10 of these 14 items as necessities, while just 15% of adults with incomes below $30,000 do the same. In short, the more money you have, the more things you need.
Other Demographic Correlations
When we analyzed the full battery of survey responses by a broad range of demographic traits – including gender, region, marriage and parenting status, race and ethnicity — we did not find any other characteristics that were as strong as age or income in predicting how people would respond. However, there are some other patterns worthy of note:
- Out in the country, a simpler life: Rural residents are less likely than those who live either in the city or the suburbs to view these 14 items as necessities. Of people living in rural areas, fully a third say just 0 to 5 of these items are necessities, compared with 23% of those in cities and 24% of those in suburbs. This difference holds even after controlling for income and internet use.
- Honey, it’s hot outside: More than eight-in-ten (84%) Sunbelt residents1 think of home air conditioning as a necessity, compared with just 61% of those who live elsewhere in the country. There’s a similar but slightly smaller regional difference in views about car air conditioning – 69% of those in the Sunbelt say it’s a necessity, compared with 54% of everyone else.
- Men are slightly more inclined than women to view the two kitchen appliances on the list – microwave and dishwasher as necessities. Women are slightly more inclined than men to see car air conditioning as a necessity. Other than that, there are no sizeable gender differences on this battery of questions.
- Differences by race and ethnicity are either modest or non-existent. However, the cell phone is an exception. Six-in-ten (59%) Hispanics consider them a necessity, compared with fewer than half of non-Hispanic whites (46%) and non-Hispanic blacks (47%). (According to the 2005 National Health Interview Survey, Hispanics are more likely than non-Hispanics to live in cell-only households. The Pew survey, however, is based on a landline sample of households and does not include the cell-only population.)
-

The more years of schooling a person has had, the more likely he or she is to view a home computer and a high-speed internet connection as a necessity. Also, as expected, being an internet user correlates very strongly with considering these items a necessity.
Does Necessity Line up with Ownership?
Having something can sometimes be a proxy for needing something. But not always.
For example, a nearly identical percentage of the public owns a car (92%) and considers a car a necessity (91%). On the other hand, nearly everyone (98%) owns a television, but just 64% of adults consider it a necessity. Also, more than eight-in-ten (82%) have a satellite or cable television service, but just a third consider it a necessity.
Two items on the list – a clothes washer and dryer – are anomalies for a different reason. They’re the only ones for which the percentage of the public that considers them a necessity is greater (albeit only slightly) than the percentage of the public that owns them.
About this Survey
Results for this survey are based on telephone interviews conducted with a nationally representative sample of adults, ages 18 years and older, living in continental U.S. telephone households.
- Interviews conducted Oct. 18 – Nov. 9, 2006
- 2,000 interviews
- Margin of sampling error is plus or minus 2.5 percentage points for results based on the total sample at the 95% confidence level. The margin of sampling error is higher for results based on subgroups of respondents.
Survey interviews conducted under the direction of Princeton Survey Research Associates International. Interviews were conducted in English and Spanish.
Bear in mind that question wording and practical difficulties in conducting surveys can introduce error or bias in the findings of opinion polls.
Read the full report for more details.


