There is no consensus in the latest round of polling as to who is ahead in the presidential race. Sen. John Kerry holds a small but statistically significant lead in surveys by Gallup and the Los Angeles Times. President Bush has a small edge in surveys by AP-Ipsos and Fox News/Opinion Dynamics. And the race is nearly dead-even in the ABC News/Washington Post and Newsweek polls.

These differences have led some critics to conclude that the polls do not work as well as they once did. But a review of several national polls over the last two months shows that the surveys are not fluctuating more than in recent elections with the notable exception of 1996, when surveys were unusually stable and consistent. This year, the polls seem more inconsistent because the race is very close. As a consequence, the lead changes with even normal fluctuations in candidate support levels.
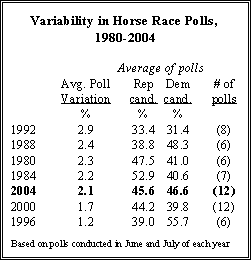
In the Pew Research Center’s analysis of 12 surveys of registered voters conducted by major national polling organizations in June and July 2004, the average of all polls found Kerry with 46.6% and Bush with 45.6%. Candidate support in the 12 polls has, on average, varied only by about two percentage points (2.1%) from these overall measures.1 This is on par with the variability of polls conducted during this period in the past six presidential campaigns, and is well within the range that would be expected given the margin of error.2
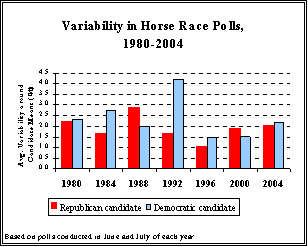
The polling variability in 2004 falls close to that seen in 1984 and 1988, when the average spread was 2.2% and 2.3%, respectively, and slightly above the election of 2000 (at 1.7%).

The greatest variability in the polls was seen in 1992, when Ross Perot’s on-again, off- again candidacy and Bill Clinton’s rising support in the June-July time frame resulted in average polling variability of 2.9 percentage points. By contrast, the 1996 campaign, when Clinton consistently held a large lead over challenger Bob Dole, saw the least variation from one poll to the other (an average spread of 1.2 percentage points).
Notes
1. The measure of polling variability is computed as the average difference of all polls from the mean support level for each candidate. This produces two estimates of variability for each election (one for the Democrat and one for the Republican), which are then averaged to produce a single statistic for each election. For 1992, the average includes polling estimates for Ross Perot as well as for George H. W. Bush and Bill Clinton.
2. This analysis excludes one-day (or “overnight”) polls conducted by news organizations to gauge immediate reactions to events in the campaign such as the naming of the vice presidential candidate. The movement in candidate support found in such polls tends to be ephemeral.