For updated data on U.S. Latino population growth and dispersion see, “U.S. Hispanic population continued its geographic spread in the 2010s.”
The nation’s Latino population has long been characterized by its rapid growth and by its wide dispersion to parts of the country that traditionally have had few Latinos. But a new Pew Research Center analysis of U.S. Census Bureau data finds that the growth and dispersion of the U.S. Latino population has slowed since 2007, when the Great Recession started, immigration from Latin America cooled and Latino fertility rates declined sharply.
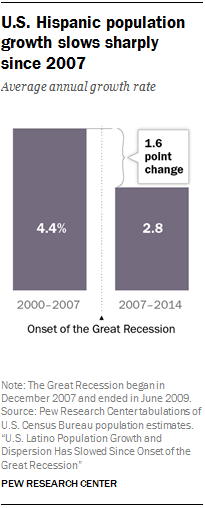
Between 2007 and 2014, the U.S. Hispanic population grew annually on average by 2.8% (its pace of growth has been an even slower 2.4% between 2010 and 2014). This was down from a 4.4% growth rate between 2000 and 2007 and down from 5.8% annually in the 1990s. As a result, the Hispanic population, once the nation’s fastest growing, has now slipped behind Asians (whose population grew at an average annual rate of 3.4% from 2007 to 2014) in its growth rate.
This slowdown has been driven by two, large demographic trends affecting the Hispanic community. Immigration, which in the 1980s and 1990s was the principal driver of Hispanic population growth, began to slow in the mid-2000s. And, in the case of Mexico, immigration has now reversed back toward Mexico since 2009. As a result, the main driver of Hispanic population growth shifted to U.S. births. But here too, change is underway: Throughout much of the early 2000s birth rates of Hispanic women ages 15 to 44 were about 95 births per 1,000 women, reaching a peak of 98.3 in 2006. However, since the onset of the Great Recession, their birth rates have declined, steadily falling to 72.1 births per 1,000 Hispanic women ages 15 to 44 in 2014.
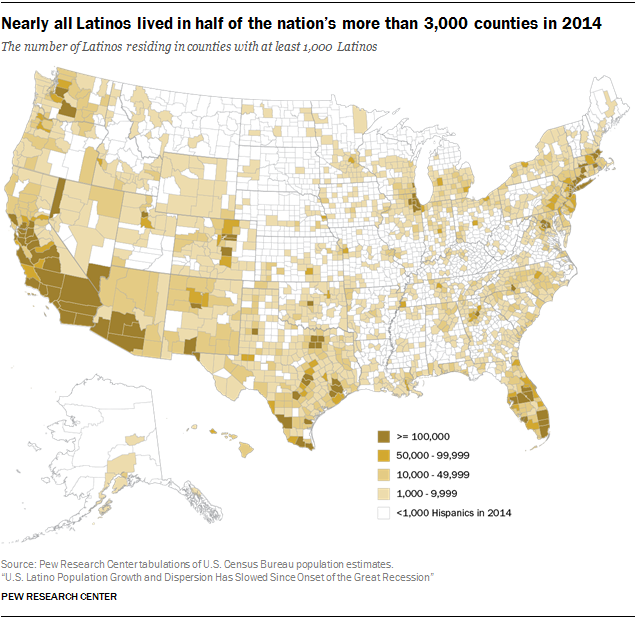
General population growth and economic opportunities in places that traditionally had few Latinos led to the dispersal of the Latino population across the U.S. beginning in the 1990s, just as Latino population growth was accelerating. 1 In the 1990s, North Carolina led in Latino population growth as new immigrant arrivals and their families moved there to pursue job opportunities in agriculture and manufacturing. In the 2000s, counties in Georgia saw some of the fastest growth nationally in their Latino populations. By 2014, a record 1,579 counties (about half of all U.S. counties) had at least 1,000 Latinos, up from just 833 in 1990. Overall, these 1,579 counties in 2014 contained 99% of the U.S. Latino population.
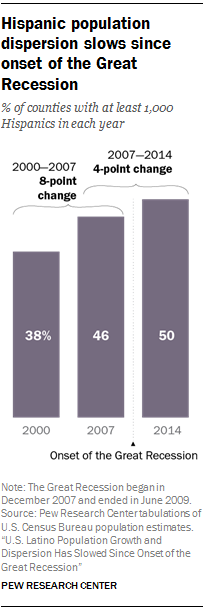
Yet the new analysis shows that Hispanic population dispersion, while continuing, has also slowed since 2007. For example, the share of U.S. counties with at least 1,000 Hispanics rose more rapidly before the onset of the Great Recession than after: Between 2000 and 2007, there was an 8-percentage-point gain in the share of U.S. counties with at least 1,000 Hispanics, rising to 46% from 38% in 2000. Yet while half of U.S. counties met this criterion in 2014, the share that did so was up only 4 percentage points since 2007, when 46% of all counties did. Other measures of dispersion show a similar slowing trend (see Chapter 1 for more details).
The slowdown in Latino settlement to traditionally non-Latino areas reflects changes in the demographics of Latinos, but also that the counties with few Latinos today are generally smaller counties overall. The 1,562 counties with fewer than 1,000 Hispanics in 2014 are largely located in non-metropolitan areas of the country and have a median population of about 13,000 people. In the coming years, while some Latinos may move there, it is possible that the slowdown in dispersion will continue.
These two trends – rapid population growth and geographic dispersion – have led to a number of Latino-driven demographic changes nationwide since 1990. As of 2012, 17 states had kindergarten student populations that were at least 20% Latino, up from just eight states in 2000. And the growing and dispersing Latino population has led to rising electoral influence of Latino voters in recent elections as the number eligible to vote has grown in many battleground states such as Colorado, Nevada, Virginia and North Carolina, even though Latino voters are largely concentrated in non-battleground states like California and Texas. Yet the slowdown in Latino population growth and dispersion may slow these trends as well in the coming years.
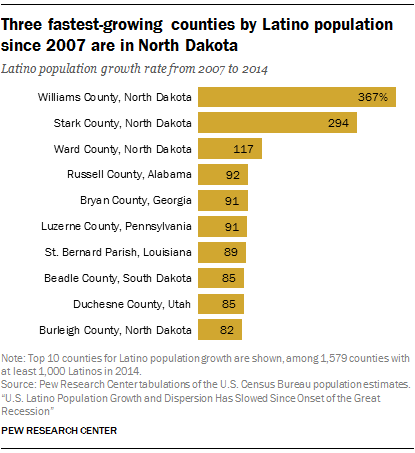
South continues to lead in Hispanic population growth, but three fastest growing counties are in North Dakota
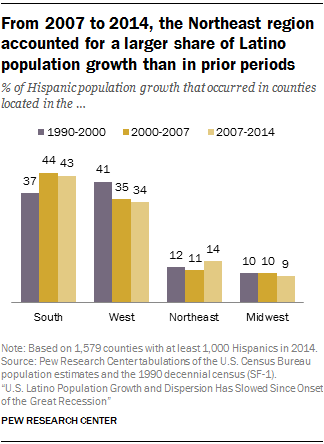
Regional growth patterns have changed some following the start of the Great Recession. While counties in the South continued to account for the largest share of the nation’s Hispanic population growth (43% between 2007 and 2014, a small decline from 44% between 2000 and 2007), counties in the Northeast – particularly those in New Jersey, New York and Pennsylvania – accounted for a larger share of national Hispanic population growth since 2007 than in 2000-2007 (14% vs. 11%, respectively). 2 There was a small decline for all of the other regions of the U.S. during these periods.
Counties in Southern states have long dominated the list of the fast-growing Hispanic counties. This was especially true from 2000 to 2007, when eight of the 10 fastest growing counties were in the South.
However, since the start of the Great Recession counties in North Dakota have topped the list. Williams County, Stark County and Ward County have all seen their Hispanic populations more than double from 2007 to 2014 (though from a small base). In fact, North Dakota’s statewide Hispanic population nearly doubled to 18,000 in this same time period, making it the state with the highest Hispanic growth rate (though it ranks 49th among the 50 states and the District of Columbia by Hispanic population). 3 Other counties outside the South that are among the 10 fastest-growing include Luzerne County in Pennsylvania, Beadle County in South Dakota, Duchesne County in Utah and Burleigh County in North Dakota. Overall, just three of the top 10 fastest growing counties by Hispanic population since 2007 were in the South.
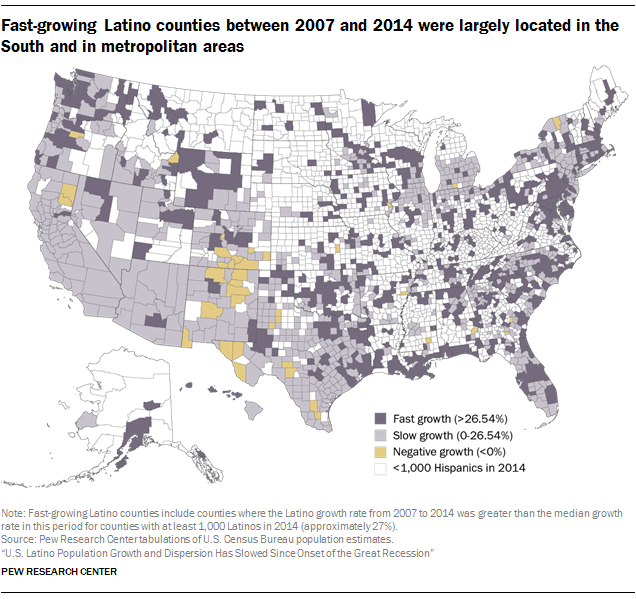
More generally, the median growth rate of Latino populations in counties across the nation from 2007 to 2014 was about 27%. Counties that exceeded this average – fast-growing Latino counties – were largely metropolitan, were located in the South and had relatively small Latino populations. Because of the relatively small size of the Latino population in these counties, they account for just 37% of the nation’s Latino population growth.
Accompanying this report are interactive county maps documenting the Hispanic population in the nation’s counties in 1980, 1990, 2000, 2010 and 2014; an interactive state map and demographic and economic profiles of the Hispanic population in each of the 50 states and the District of Columbia (see Chapter 4 for an overview of the Hispanic population in the states); and an interactive map and demographic and economic profiles of the 60 metropolitan areas with the largest Hispanic populations (see Chapter 5 for an overview of the Hispanic population in metropolitan areas). The metropolitan area interactive also has a table showing the largest population and shares for the 11 largest Hispanic origin groups: Mexicans, Puerto Ricans, Salvadorans, Cubans, Dominicans, Guatemalans, Colombians, Hondurans, Spaniards, Ecuadorans and Peruvians.
Other key findings from the report include:
National population growth
- Despite slowing population growth, Latinos still accounted for more than half (54%) of the nation’s population growth between 2000 and 2014.
Latinos in the counties
- Latinos account for more than half of the population growth in 41% of U.S. counties with at least 1,000 Latinos in 2014. About a third of these counties were located along the Southwest border and about half are in non-metropolitan areas.
- The nation’s Hispanic population is not growing everywhere. Between 2007 and 2014, the Hispanic population declined in 38 counties with at least 1,000 Hispanics in 2014, most of which were located in Colorado, New Mexico and Texas.
- Among the nation’s counties with at least 1,000 Latinos in 2014, 23 counties are majority foreign born among Latinos.
States
- The five states with the largest Hispanic populations are California (15 million), Texas (10.4 million), Florida (4.8 million), New York (3.7 million) and Illinois (2.2 million). Together, these states hold 65% of all Hispanics.
- But New Mexico leads the states for the share of the state population that is Hispanic (48%), followed by California and Texas (39% each). Arizona and Nevada round out the top five states for the share of the population that is Hispanic with 31% and 28%, respectively.
- In most states, U.S.-born Hispanics outnumber foreign-born Hispanics. However, there are two exceptions: In the District of Columbia 53% of Hispanics were foreign born in 2014, and in Maryland half of Hispanics were foreign born. Most of the top 10 states ranked by the foreign-born share among Hispanics are located in the South.
Metropolitan areas
- In 2014, more than half of U.S. Hispanics resided in the 15 largest metropolitan areas by Hispanic population. Los Angeles-Long Beach-Anaheim, CA topped the list with 6 million Hispanics – more than the Hispanic population in all but two states, California and Texas.
- Behind the Los Angeles metropolitan area are New York-Newark-Jersey City, NY-NJ-PA (4.8 million), Miami-Fort Lauderdale-West Palm Beach, FL (2.6 million), Houston-The Woodlands-Sugar Land, TX (2.3 million), Riverside-San Bernardino-Ontario, CA (2.2 million) and Chicago-Naperville-Elgin, IL-IN-WI (2.1 million).
- Among the 15 largest metropolitan areas by Hispanic population, only two are majority foreign born. In Miami-Fort Lauderdale-West Palm Beach, FL, 61% of the area’s 2.6 million Hispanics are immigrants. Following that is the Washington-Arlington-Alexandria, DC-VA-MD-WV metropolitan area, where 53% of Hispanics are immigrants.
- The geographic settlement of Hispanics is closely linked with Hispanic origin. Hispanics of Mexican origin are the largest Hispanic origin group in many Southwest border metropolitan areas, but along the East Coast there is more diversity. Cubans are the largest Hispanic origin group in the Miami metropolitan area, while Puerto Ricans are the largest origin group in the New York, Orlando, Philadelphia and Hartford, CT metro areas. Meanwhile, Salvadorans are the largest origin group in the Washington, D.C., area.
The terms “Latino” and “Hispanic” are used interchangeably in this report.
“U.S. born” refers to individuals who are U.S. citizens at birth, including people born in the United States, Puerto Rico or other U.S. territories, as well as those born elsewhere to parents who were U.S. citizens.
“Fast-growing” counties are those counties where the Hispanic population has grown at a rate above the median growth rate for that time period and had at least 1,000 Hispanics in the latter year. For example, from 2007 to 2014 the median Hispanic growth rate for counties with at least 1,000 Hispanics in 2014 was 26.54%. Counties that had growth rates of more than 26.54% and had more than 1,000 Hispanics in 2014 are considered to be fast-growing counties in this time period. “Slow-growing” counties are counties with Hispanic growth rates that fall at or below the median growth rate and had at least 1,000 Hispanics in the latter year. “Negative-growth” counties are those counties where the Hispanic population declined, but still had at least 1,000 Hispanics in the latter year.
Northeast, Midwest, South and West refer to census regions that divide the United States into groups for analyses. The Northeast region is comprised of Connecticut, Maine, Massachusetts, New Hampshire, New Jersey, New York, Rhode Island, Pennsylvania and Vermont. The Midwest region: Illinois, Indiana, Iowa, Kansas, Michigan, Minnesota, Missouri, Nebraska, North Dakota, Ohio, South Dakota and Wisconsin. The South region: Alabama, Arkansas, Delaware, District of Columbia, Florida, Georgia, Kentucky, Louisiana, Maryland, Mississippi, North Carolina, Oklahoma/Indian Territory, South Carolina, Tennessee , Texas, Virginia and West Virginia. The West region: Arizona, Alaska, California, Colorado, Hawaii, Idaho, Montana, Nevada, New Mexico, Oregon, Utah, Washington and Wyoming.
The New England census division comprises Connecticut, Maine, Massachusetts, New Hampshire, Rhode Island and Vermont. The Middle Atlantic division: New Jersey, New York and Pennsylvania. The East North Central division: Illinois, Indiana, Michigan, Ohio and Wisconsin. The West North Central division: Iowa, Kansas, Minnesota, Missouri, Nebraska, North Dakota and South Dakota. The South Atlantic division: Delaware, District of Columbia, Florida, Georgia, Maryland, North Carolina, South Carolina, Virginia and West Virginia. The East South Central division: Alabama, Kentucky, Mississippi and Tennessee. The West South Central division: Arkansas, Louisiana, Oklahoma/Indian Territory and Texas. The Mountain division: Arizona, Colorado, Idaho, Montana, Nevada, New Mexico, Utah and Wyoming. The Pacific division: Alaska, California, Hawaii, Oregon and Washington.
Non-metropolitan counties include those which are within micropolitan statistical areas and outside of the core-based statistical areas (CBSA).
