Illinois
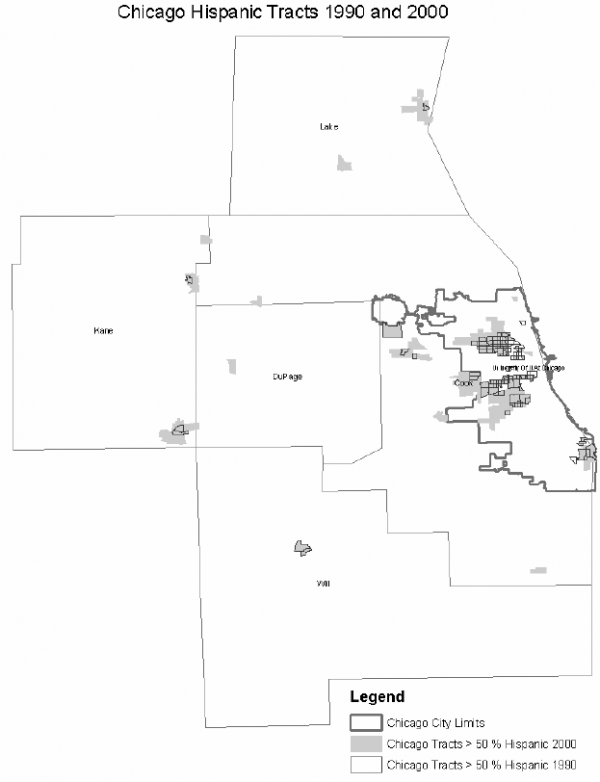
After a process of Hispanic settlement that dates back to the 1920s, substantial communities with contiguous majority-Latino tracts had developed in several parts of Chicago by 1990. A scattering of Latino neighborhoods had also emerged in suburban areas.
Illinois added 650,000 Hispanics between 1990 and 2000, and this increase was overwhelmingly (92%) registered in the Chicago metropolitan area (the Chicago PMSA which includes the five counties shown on the map below).6 So, within the state the growth was geographically highly concentrated. And, 55 percent of this additional population of Hispanics was located in majority-Latino neighborhoods in the Chicago area. Another, 37 percent of the increase in the state’s Latino population went to “non- Hispanic” neighborhoods in metropolitan Chicago. As shown on the map below, the growth of the Latino population led to the substantial geographic expansion of existing enclaves. Yet, at the same time, a smaller but still substantial process of dispersal was taking place as a third of the added population was scattered through “non-Latino” neighborhoods.

New York
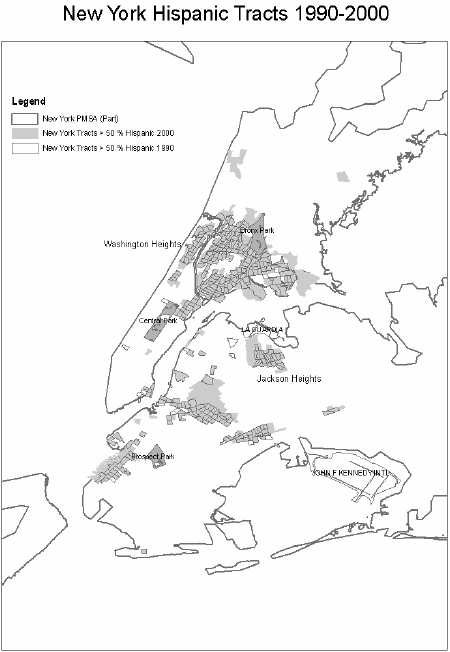
The state of New York added 713,275 Latinos to its population between 1990 and 2000. As in Illinois, nearly all (91%) of the increase took place in a single major metropolitan area, the New York City PMSA.7 In 2000, half of this growth was to be found in majority Hispanic neighborhoods within the New York PMSA, and another 41 percent was added to minority-Latino tracts in the same area. Again, as in the case of Chicago, non-Hispanic communities that were geographically contiguous to majority Hispanic neighborhoods in 1990 had gained a majority Latino population by 2000. An increase in the Hispanic population was accompanied by a process of geographic expansion of the largely contiguous majority Hispanic neighborhoods even as a sizeable portion of the Latino population found homes in non-Hispanic communities.

Florida
Florida’s Latino growth pattern was much more geographically diffuse than in other traditional Hispanic states. This may reflect the attractiveness of the state to both domestic and international migrants. While other studies have shown that the Miami-Ft Lauderdale CMSA was a magnet for immigrants over the decade, the Tampa-St. Petersburg-Clearwater and Orlando metropolitan areas (not shown in map) attracted Latino movers from elsewhere in the United States.8 Of the 1.1 million Latinos added to the state of Florida between 1990 and 2000, fewer than half (45 percent) were added in the Miami-Ft Lauderdale CMSA. More (55 percent) were added outside the bounds of the Miami Ft. Lauderdale CMSA, and most of them were found in “non-Hispanic” neighborhoods in 2000.9 Only 32 percent of the increase in Florida’s Hispanic population was added in the Latino neighborhoods of Miami-Ft Lauderdale CMSA.
California
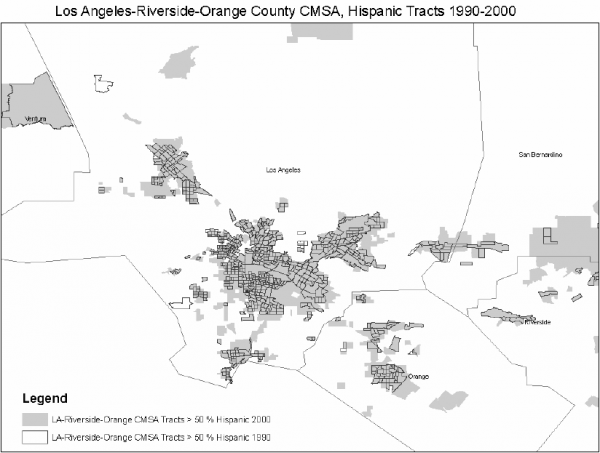
California’s Latino population grew by 3.4 million people between 1990 and 2000. A little over half (55 percent) of California’s Latino growth was in and around Los Angeles, and in that swath of Southern California almost all of the increase went into majority Latino neighborhoods. In the Los Angeles-Riverside-Orange County CMSA, the Latino population grew by 1.9 million, and 1.7 million were added to Latino neighborhoods within that area.10 On the fringes of the metropolitan area, large expanses of majority-Latino neighborhoods developed where in 1990 there had only been a handful of majority-Latino tracts. Meanwhile, an almost equal number (1.5 million) of additional Latinos found homes in California outside the Los Angeles metropolitan area.

Arizona
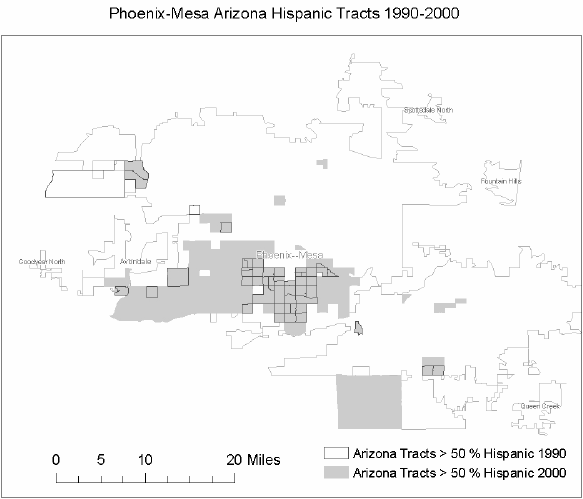
Among the new settlement states, Arizona was the only state that added more than half a million Latinos between 1990 and 2000. Compared to Illinois and New York, a lesser share (72 percent) of the Latino growth was in state’s largest metropolitan area, the Phoenix-Mesa MSA. And, compared to California, a smaller share (38 percent) went into majority-Latino neighborhoods.

Georgia
Georgia had no neighborhoods that were more than 50 percent Hispanic in 1990 and only a handful in 2000. Only six percent of the Hispanic population of Georgia resided in these concentrated Latino neighborhoods in 2000. Most of the Latino population growth was in the Atlanta metro area, with most Latinos added in minority- Latino neighborhoods.11 However, among the non-metro areas, Dalton, GA. attracted many Latinos. Work in the carpet industry drew many Latinos to this small town in Georgia. And similar settlements in non-metro areas of Georgia have been established around poultry processing plants.