Data sources and analytical approaches used in the report are described in this section.
First, this appendix provides shares of the populations that are represented in the study and details on the underlying source data. It goes on to explain how household types were categorized based on relationships in household rosters and how household sizes were derived. Finally, it describes adjustments made to the data, weighting procedures and data aggregation.
Coverage
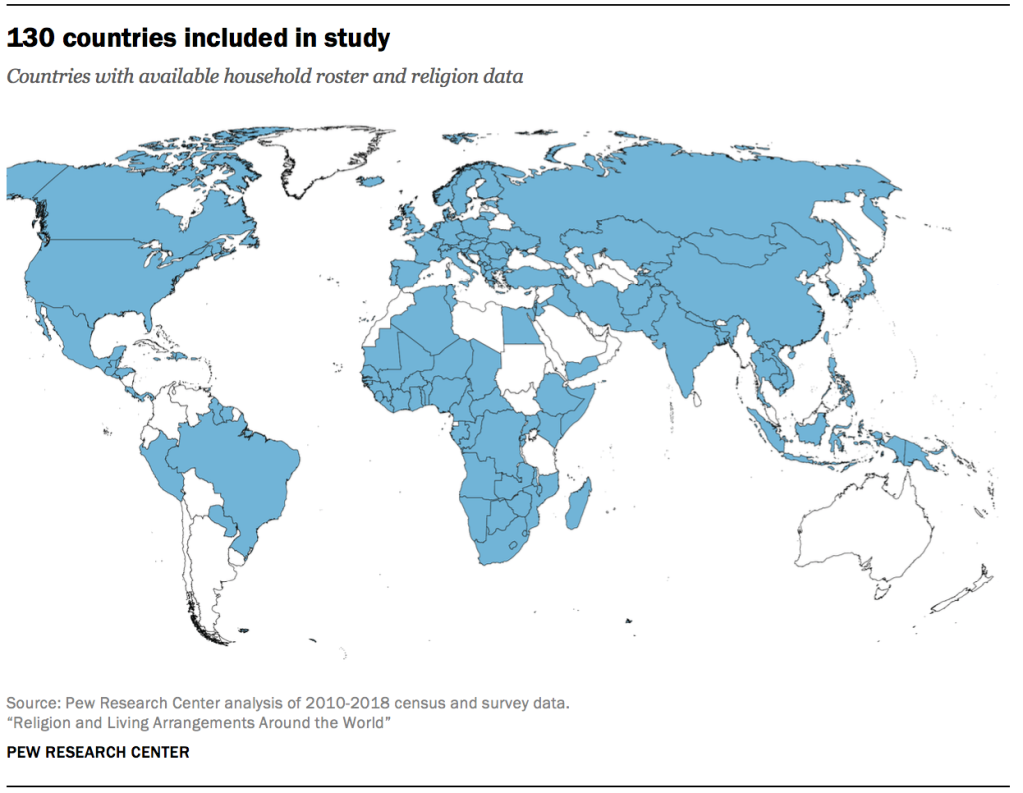
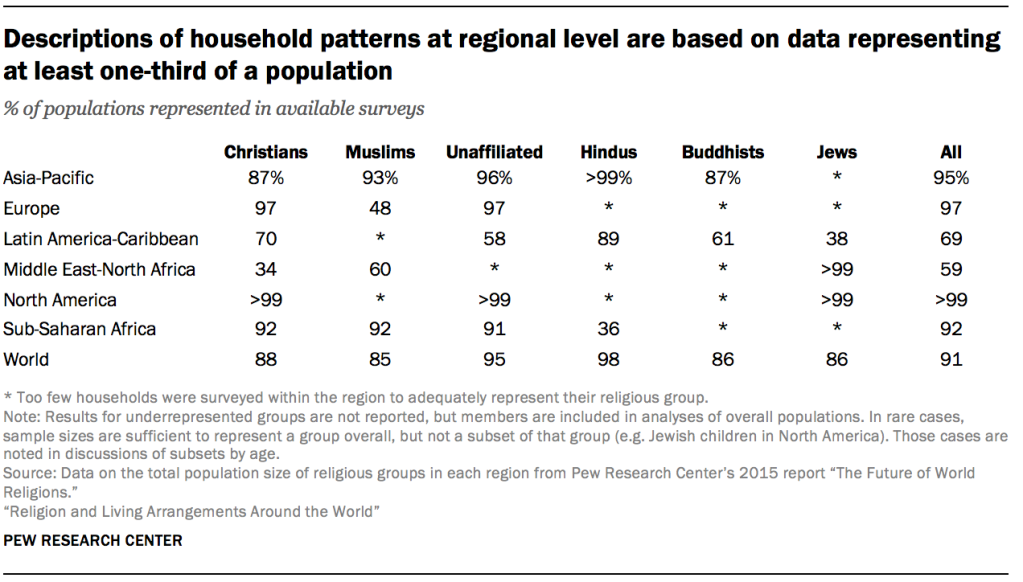
Source data for this study comes from 130 countries, which are home to 91% of the global population. By region, the study covers countries representing 95% of the total population of the Asia-Pacific region, 97% of Europe, 69% of the Latin America-Caribbean region, 59% of the Middle East-North Africa region, more than 99% of North America and 92% of sub-Saharan Africa.
Data underlying the analyses in this report comes from a variety of censuses and surveys, all gathered since 2010. The analyses required data on religious affiliation and household rosters – lists of every member of a household along with their age, sex and relationship to the survey respondent. Rosters were used to code household type (see more on household relationships and type below).
In countries where data sources that included religion were not available but more than 95% of the population belongs to the same group, the religious affiliation of the overwhelming majority of the country’s population was assigned to the sample for analysis.
When possible, census data is used as the source of country data. However, when census data on both religion and household composition was unavailable – many countries including the United States do not measure religion on their census – the analysis relies on well-established nationally representative sources, such the Demographic and Health Survey (DHS), Multiple Indicator Cluster Survey (MICS) and European Social Survey (ESS). The best available data source with information on both religion and household composition was used for each country. Household rosters and religion variables were standardized and aggregated across surveys; more detail on those processes can be found below. The aggregated dataset for the 130 countries of this study includes 82.6 million individuals from 20.8 million households. For a full list of sources used by country, see Appendix B.
Although Australia and New Zealand do measure religion and household composition in their censuses, individual-level census microdata from these countries are not readily available (microdata from many country censuses are available via the IPUMS International archive). Due to this lack of readily available data, results for Australia and New Zealand were not obtained.
Results are reported only for groups that reach certain coverage thresholds. For the sake of reliability, only religious groups represented by at least 125 households have statistics reported separately at the country level. Within those households, researchers required a minimum of 125 people who met the relevant demographic criteria for analyses of household characteristics by age or sex. For example, more than 125 Jewish respondents in the United States provided information on their living arrangements, so their household patterns are presented. However, these same households contained fewer than 125 Jewish children, so living arrangements of Jewish children in the U.S. are not reported in the discussion of age patterns in Chapter 3. To obtain an adequate sample to represent Jews in the U.S., Pew Research Center aggregated 2010 to 2016 waves of the General Social Survey (GSS). Data for every other country came from a single wave.
There are two thresholds for inclusion of religious groups at the regional level: There must be a minimum of 500,000 people of that religion living in the region and the countries in which a sufficient number of households were surveyed (125 or more) must represent a minimum of one-third of that religious group’s regional population. There were two cases in which the latter condition was met but not the former: Buddhists in the Latin America-Caribbean region, where appropriate data with large samples was available but only about 430,000 of the world’s Buddhists reside (out of about 500 million Buddhists worldwide), and Jews in the same region, where only about 480,000 Jews reside out of over 14 million worldwide.
Estimates of the size of religious group populations come from calculations made for Pew Research Center’s 2015 report “The Future of World Religions: Population Growth Projections, 2010-2050.” In the example of U.S. Jews, more than 125 Jewish households were surveyed in both the U.S. and Canada, the countries where more than 99% of the North American Jewish population resides, so coverage is sufficient and results are broken out for individuals living in Jewish households in North America.65 However, results for Hindus living in North America are not reported separately because most (80%) of the region’s Hindus live in the U.S., which lacks sufficient data (fewer than 125 households) on the composition of Hindu households. Even when respondents from particular groups are not reported separately, they are still included in analyses of the overall population – the “all” category – both at the country level and the regional level. At the global level, at least 85% of the population of each major religious group is represented in the study.
Included countries by region
There is sufficient data to report on:
- 26 countries and territories in the Asia-Pacific region: Afghanistan, Armenia, Bangladesh, Cambodia, China, Cyprus, India, Indonesia, Iran, Japan, Kazakhstan, Kyrgyzstan, Laos, Maldives, Mongolia, Nepal, Pakistan, Papua New Guinea, the Philippines, South Korea, Taiwan, Tajikistan, Thailand, Timor-Leste, Turkey and Vietnam
- 35 countries in Europe: Albania, Austria, Belgium, Bulgaria, Croatia, the Czech Republic, Denmark, Estonia, Finland, France, Germany, Greece, Hungary, Iceland, Ireland, Italy, Kosovo, Lithuania, Moldova, Montenegro, the Netherlands, North Macedonia, Norway, Poland, Portugal, Romania, Russia, Serbia, Slovakia, Slovenia, Spain, Sweden, Switzerland, Ukraine and the United Kingdom
- 19 countries and territories in the Latin America-Caribbean region: Barbados, Belize, Brazil, Costa Rica, the Dominican Republic, El Salvador, Guatemala, Guyana, Haiti, Honduras, Jamaica, Mexico, Panama, Paraguay, Peru, Puerto Rico, St. Lucia, Suriname and Trinidad and Tobago
- Eight countries and territories in the Middle East-North Africa region: Algeria, Egypt, Iraq, Israel, Jordan, the Palestinian territories, Tunisia and Yemen
- Two countries in North America: Canada and the United States
- 40 countries in sub-Saharan Africa: Angola, Benin, Botswana, Burkina Faso, Burundi, Cameroon, the Central African Republic, Chad, Comoros, the Democratic Republic of Congo, Ethiopia, Gabon, Gambia, Ghana, Guinea, Guinea-Bissau, the Ivory Coast, Kenya, Lesotho, Liberia, Madagascar, Malawi, Mali, Mauritania, Mozambique, Namibia, Niger, Nigeria, Republic of the Congo, Rwanda, Sao Tome and Principe, Senegal, Sierra Leone, Somalia66, South Africa, Swaziland, Togo, Uganda, Zambia and Zimbabwe.
Variables

Age and sex variables used in this study were readily available across all sources. Other variables, including household religion, size and type were constructed through the processes described below.
Household religion
In this study, results are reported for six major religious groups: Christians, Muslims, the religiously unaffiliated, Hindus, Buddhists and Jews. People affiliated with other religious groups are included in overall global, regional and country-level results, but they are not reported on separately.
Members of a household tend to share the same religion, but there is variation in the extent to which available data distinctly measures the religion of each household member. In most countries covered in this report, religion is measured for the respondent but not for other household members. As a result, in each of these countries, the religion of the respondent was assigned to everyone in the household.
However, in the 20 countries shown in the adjacent table, religions of all household members ages 15 and older were collected, allowing researchers to categorize all household members in these countries according to their own religious affiliation. (As this table shows, multi-religion households are generally rare. In India, for example, 98% of households are single-religion. But there are some exceptions: In Trinidad and Tobago, for example, nearly one-in-five households have members whose religious affiliation is different from the respondent’s.)
All children under 15 covered in this report are categorized using the respondent’s religion. Few sources gather information on children under 15 unless they are household heads (and therefore also respondents) themselves. That is an extremely rare occurrence; it affects less than 0.1% of children.
In addition to the 112 countries for which data is available on both household structure and religion, this report also includes 18 countries and territories in which at least 95% of the total population identifies with one religious group (based on Pew Research Center’s 2015 report “The Future of World Religions: Population Growth Projections, 2010-2050”). These 18 countries and territories are Afghanistan, Algeria, Iran, Jordan, Maldives, Mauritania, Moldova, Niger, Pakistan, the Palestinian territories, Peru, Puerto Rico, Somalia, Tajikistan, Timor-Leste, Tunisia, Turkey and Yemen. In these cases, household data for the general population is used to describe household characteristics, with all individuals coded as identifying with the religious group of the overwhelming majority of the country’s population.
Imputing religion for Demographic and Health Survey (DHS) samples with partial information on the religious identity of household members
Data for 35 countries in this study is from DHS. The surveys generally asked the religious affiliation question only of household members in the reproductive age range (15 to 49). The 2015 survey of India, which asked about the religious affiliations of all household members ages 15 and older, is an exception.
Among the other 34 DHS countries, household religion was not asked of anyone in seven of the countries, but all seven have at least 95% of the total population identifying with one religious group. In an eighth country, Timor-Leste, religion was asked of household members in the reproductive age range, however, because more than 99% of the country is Christian, researchers assumed that all households in the country were Christian. Christians also make up more than 95% of the population in Peru. Muslims make up more than 95% of the population in the other six countries (Afghanistan, Jordan, Niger, Pakistan, Tajikistan and Yemen). For these countries, the predominant religious identity is used for all households and individuals.
For each of the remaining 26 countries, more than two-thirds of people live in a household where someone provided religion information: Roughly one-third of people provided their own religion, while more than a third of people had religion assigned based on someone else in the household who provided their own religious affiliation. In the latter case, household members without religion were imputed by assigning religious values of reproductive-age women or men who live in the same household. In cases where multiple religions were measured among multiple adults of reproductive age, assignment was based on a hierarchy of relationship closeness (in order: spouse, parent, child, other relative). For instance, if a male head of household was not asked about his religion since he was too old to be included in the fertility survey, but he lived with his Muslim reproductive-aged wife and his religiously unaffiliated nephew, his religious affiliation was assigned as Muslim.
At the individual level and in a typical country relying on DHS data, 81% of the household population is represented by a sampled household with directly reported information on the religion of at least one member.
For the remaining households in which there were no members of reproductive age, and therefore no information about religious identity was gathered, multiple imputation was applied using the multivariate imputation by chained equations (MICE) algorithm in Stata. There was enough information about adults not of reproductive age in households with adults of reproductive age to identify age, sex, marital status, educational attainment, household size, region and urbanicity as predictors of religion and use them in the imputation. Five iterations were executed with these predictors (independent variables) for the missing data on religion.
Household size
For the purposes of this study, a household is a private dwelling unit that is not vacant and is not an institution (such as a college dormitory or nursing home). The household population is made up of all people who reside in households (not in institutions). Household size is the number of persons living in a household. Average size at the household level overall is derived by dividing the total household population (that is, the non-institutionalized population) by the total number of households. Average household size for a religious group was derived by dividing the total population affiliated with that religion by the total number of households headed by a person affiliated with that same religion (except for in the 20 countries where religious affiliation was captured for all household members over age 15). These household-level sizes were then transformed to represent the experiences of individuals. A simplified example of this process is described below, and more details can be found in this sidebar.
A small village is made up of only 50 homes. Thirty homes contain large households of 10 people each, and each of the remaining 20 homes contain two people. At the household level, the average size is 6.8.

But if all 340 villagers gather to compare their living situations, there will be 300 people who report experiencing large, 10-person households, and 40 people who live in pairs. The average villager experiences a household size of 9.1.

Unless specified otherwise, all results in this report reflect the average experience of individuals (such as a household size of 9.1 in the example above) rather than average values at the household level (6.8 in the example above).
Household type
For this study, households were categorized into types that describe qualitative differences in living arrangements that are not captured by household size alone. As with household size, the prevalence of household types is reported from the perspective of individuals. Household type categories are based on relationships between members and the ages of people identified as children of the respondent. Household rosters from every source dataset were coded to produce a standardized set of seven household types that are referred to throughout this report: Extended family, two-parent, adult child, couple, solo, single-parent and polygamous. About 98% of the global household (non-institutionalized) population lives in one of these seven household types. Regionally, the shares of people who live in a categorized household range from over 99% in the Middle East-North Africa region to 96% in sub-Saharan Africa. At the country level, the smallest share of people living in a categorized family household is 85%, in Rwanda. Members of other types of households – for example, homes of only unrelated roommates or homes with a mixture of both related and unrelated individuals – are not reported separately but remain in the denominators of analyses.67 Because of this, the shares of individuals residing in the seven household types reported do not always sum to 100.
This classification process was largely based on harmonized household definitions constructed by IPUMS International at the Minnesota Population Center, University of Minnesota. Pew Research Center analysts modified the IPUMS classification scheme to combine types not relevant to this report into the undifferentiated “other” category described above and to exclude institutions. They also added a new category – adult child – which uses the age of children (by relationship) to distinguish two-parent and single-parent households with and without minor children. When using census data from IPUMS International, Pew Research Center analysts did not reclassify household rosters that were unaffected by the new categories, and instead accepted IPUMS’ household type results (having already adopted their coding scheme), with one exception: Benin. Because of the way IPUMS classifies household members, Benin’s “other” category had an unusually large number of people. As a result, Pew Research Center recoded Benin’s census data on household types using the same process that was applied to data sources that did not come from the IPUMS archive.
Household relationships
Every data source includes a variable that describes how each individual in a household is related to the respondent who answered questions on behalf of the entire household.68 Relationships were collapsed and standardized across surveys to include consistent categories for household type coding. Categories of relationships to household respondent include:
Respondent: The individual who supplied the household roster and answered other survey questions on behalf of the household. In some data sources, the individual may be called the household head, householder or the reference person.
Spouse/cohabiter: An individual either married to or cohabiting with the respondent. Some source surveys distinguish between formally married and cohabiting partners, but some do not, so these relationships were collapsed into a single category for comparability. Cohabiting partners do not include roommates.
Child: A child of the respondent. Some data sources distinguish a biological child from an adopted, foster or stepchild, while others do not, so these were consolidated. The child category was subdivided into minor children and adult children based on whether any children (by relationship) were under or over 18 years old at the time of the survey.
Parent: Any parent of the respondent, including those other than biological parents.
Other relative: Other than a spouse, child or parent, a person in this category is an individual who is related to the respondent either by blood (a grandparent, grandchild, sibling, cousin, niece, aunt, uncle, and so on) or by marriage (a parent-in-law, child-in-law, grandparent-in-law, grandchild-in-law, sibling-in-law, cousin-in-law, niece-in-law, aunt-in-law and so on).
Non-relative: An individual who is unrelated to the respondent by blood, marriage, adoption or fostering. This category does not include partners who are living together but not married.
Unknown: A household member whose relationship to the respondent is unknown.
Defining household type
Using household individuals’ relationship to the respondent, the study classifies households into seven basic categories:
Solo: One-person household.
Couple: Married/cohabiting couple without children, other relatives or non-relatives.
Two-parent: Married/cohabiting couple with at least one minor child (under the age of 18), regardless of whether adult children also live in the home, and with no other relatives or non-relatives.
Single-parent: One parent with one or more minor children (under the age of 18), regardless of whether adult children also live in the home, and no other relatives or non-relatives.
Adult children: One or two parents with one or more of their adult children (over the age of 18) and no minor children or any other relatives or non-relatives.
Extended: A household with one or more “other relatives,” as defined above.
Polygamous: A household in which an individual lives with two or more partners, with or without children, and regardless of the presence of other relatives or non-relatives.
Other: Households that contain any non-relatives or people whose relationship to the respondent is unknown. Shares of people in this undifferentiated “other” category are not detailed throughout the report but are available in Appendix C.
Differences between estimates in this report and other reports
There are various ways to classify living arrangements. The above categories are mutually exclusive, but living arrangements can also be analyzed with overlapping categories. Consider a household with a minor child, the child’s parent and the child’s grandparent. In the classification scheme used in this report, such a household is classified as an extended-family household. However, researchers sometimes classify such households as single-parent households. When this more-expansive approach is taken, the share of children living in single-parent households often is higher.
Same-sex couples
When identifiable in source data, same-sex partners are categorized as belonging to couple, two-parent, adult child or extended-family households regardless of marital status, exactly as heterosexual couples are. Four out of 19 countries with national census agency data that includes religion specifically list same-sex spouse or partner as a relationship option.69 Other surveys used neutral language like “spouse” or “partner.” However, there are two reasons to suspect that same-sex couples are often missed in source surveys. First, some surveys do not give respondents the opportunity to identify a household member of the same sex as their spouse or significant other. For example, DHS surveys explicitly assume that partners are opposite-sex by asking women, “Are you currently married or living together with a man as if married?” and asking men only about female partners. In Portugal, the census categorized all households with same-sex partners as unclassifiable. Relatedly, same-sex partnerships are stigmatized or illegal in some countries. Same-sex partners are likely undercounted in such contexts, even when inclusive response options are available.
Part-time household members
Source surveys use a variety of language to introduce household roster questions. Commonly, questionnaires ask for details on everyone who “usually” lives in the household. For example, this is the wording used by MICS and the U.S. GSS.70 The ESS asks about members who “live here regularly.” Even subtle differences in question wording might lead to minor discrepancies in the way part-time household members (such as migrant workers or children who live in more than one home) are counted. For example, in Europe, where the survey asks about people who live in the home “regularly,” parents with weekend-only custody might include their children, whereas U.S. parents in the same situation might not include the children, because the survey wording – “usually” – may imply that these children live in the home at least half of the time.
Other demographic characteristics of religious groups
Data on the regional distributions of religious groups, their age structures and fertility rates used to complement the analyses of households in the report comes from earlier Pew Research Center reports, “The Future of World Religions” and “The Changing Global Religious Landscape.”
Minor errors in source data
Source data underwent rigorous quality control checks by census and survey organizations before being published. Despite the high quality of the source data and the care taken by survey and statistical agencies, minor discrepancies are inevitable in major data collection efforts, so conducting further quality checks while standardizing and aggregating data on nearly 83 million individuals is customary and important. Pew Research Center analysts identified and cleaned up minor data errors. For example, cases were dropped in which a household contained only one person but the relationship was coded as spouse, child or other relative instead of household head or respondent. One-person households in which the only person was younger than 12 were excluded from the analysis. Rarely, a person’s relationship to the respondent was coded as parent, even though that person was substantially younger than the respondent; or as child, with a large age gap in the other direction. In such cases, Center analysts assumed that respondents had simply answered the relationship question from the wrong perspective and reversed the parent-child relationship so that the much younger person was recoded as the child rather than the parent.
Weighting
Country weights
Survey weights make minor adjustments to account for differences between the sample and the general population of individuals or households in an area. All data files have person weights that are used to derive individual-level results from person-level data files. Further, samples of census and household survey data usually provide household weights. The comparative analyses on household-level data in this sidebar apply these weights to the analyses of household file data.
Adjustments to social surveys
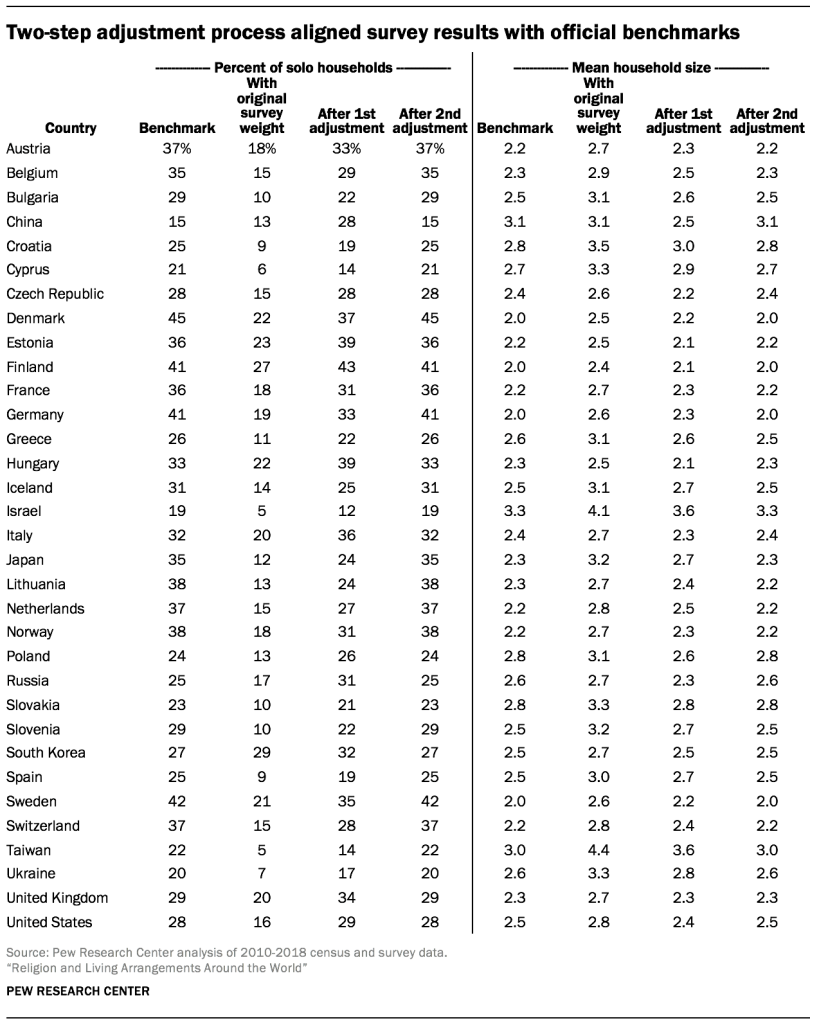
Wherever possible, household characteristics were drawn from government censuses or large household surveys in which religious identification was measured for every member of the sampled households. For 33 countries and territories, the recent censuses and household surveys do not ask a question on religious affiliation, but data is available from nationally representative modest-sample social surveys that allow for the relevant household estimates – including the Chinese General Social Survey (CGSS), European Social Survey (ESS), U.S. General Social Survey (GSS), Japan General Social Survey (JGSS), Korea General Social Survey (KGSS) and Taiwan Social Change Survey (TSCS). However, these surveys’ sample weights failed to address two related issues in derived results. First, the weighted results show the proportion of one-person households is substantially lower than estimates from official publications for every country except South Korea. Second, the resulting average household sizes are larger than those from official publications for every country except China. Center researchers recognized that the weights for these surveys are not designed to be used in measuring household characteristics, so they adjusted the sample weights in two steps to make the data files more consistent with official estimates.
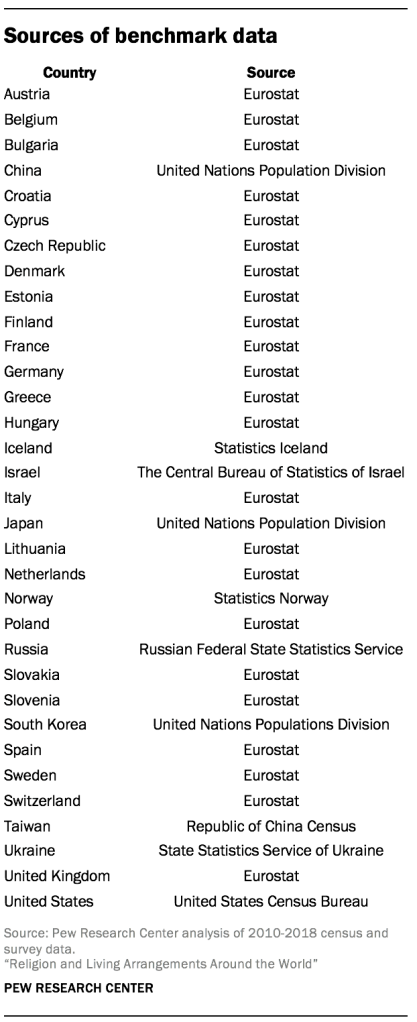
The social surveys used in this analysis are designed and weighted to be representative of the adult population in their respective countries, and respondent weights reflect the probability that one adult in each household was selected to participate. To calculate estimates for the entire population (including adults and children), the weight for each respondent was divided by the number of adults living in that household. This first adjustment effectively converts the representative sample of adults into a representative sample of households. Dividing the sample weights by the number of adults largely improved the weighted results. However, for the majority of countries, they did not match up to benchmarks. Further, for a few countries, the first-step adjustment of weights seemed to exacerbate the problems. One plausible reason is that small households – one-person households in particular – may be less likely than others to be reached by phone.
Since inconsistencies with benchmarks persisted after the first-step adjustment, weights were raked to household size data from official government statistics, which separately enumerate one-person, two-person, three-person, four-person and five-and-more-person households. The table below – which compares derived results using original survey sample weights and adjusted weights with the official data – shows that using the adjusted weights improved the accuracy of the computation. Estimates for individuals were then produced by combining these household-level weights with information on the total number of adults and children living in each household.
Weights in computing global and regional household characteristics
Pew Research Center used national-level results to calculate regional and global distributions. Household populations (overall and by religion) were applied as country-level weights in deriving data on personal living arrangements in each region and around the world. The estimates of the 2015 size of religious groups at the country level are from the demographic projections by Pew Research Center, which include the household and non-household populations (for example, people living in institutions). To adjust for the fact that homeless individuals and residents of institutions are not included in this study, the population of each country was reduced by 3%. This figure is based on available information from the U.S., the UK and Canada. While it is possible that these relatively wealthy Western countries have higher-than-average shares of people living in non-households, corresponding figures on the precise size of non-household populations are not readily available for all countries in this study. This population adjustment was applied only at the country level, without further adjustments for any potential religious or other differences between household and non-household populations.
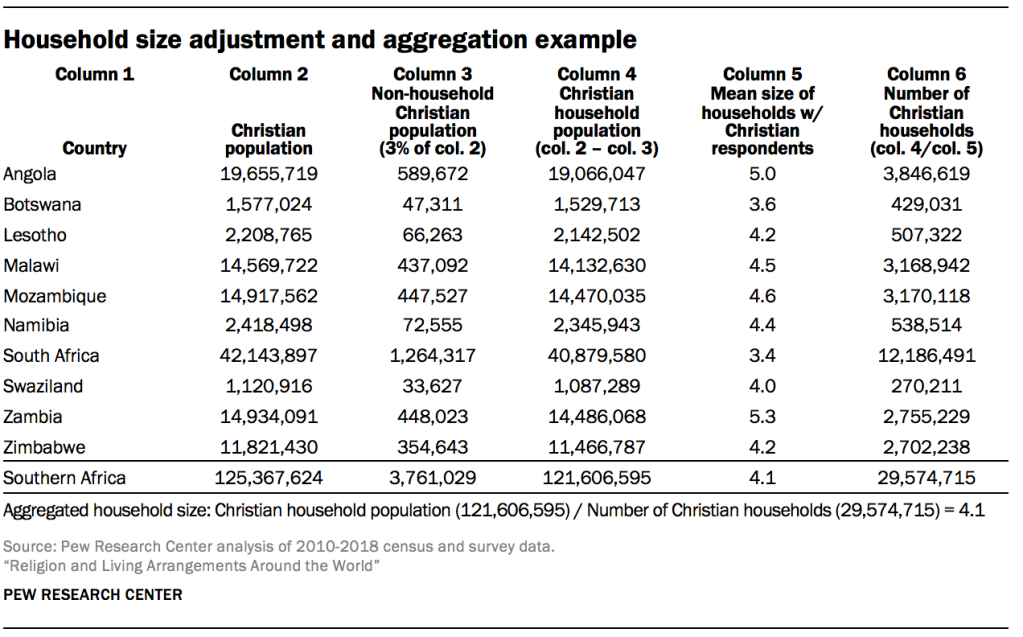
Aggregating individual-level data to represent regional and global populations, overall and by religious group based on the Center’s own demographic projections, was relatively straightforward. In order to produce the comparisons between individual and household-level results shown in this sidebar, researchers also aggregated results from household files. Since data with estimates on the number of households in every studied country was not available, a new procedure was developed. To aggregate household sizes and living arrangements at the household level, researchers first divided the household population by mean household size to derive the total number of households, for all people and by religion, for each country. Next, total regional or global household populations and total number of households were summed, respectively. Then the mean regional household size was derived by dividing the aggregated total household population by the aggregated total number of households.
To explain how the household weights are computed and used in aggregating average household size by religion, consider the Christian population and number of households in Southern Africa as an example. In the table, column 1 shows the names of 10 Southern African countries. Column 2 shows the Christian population in each country in 2015. Column 3 shows the non-household Christian population (3% of the total). Column 4 shows the total Christian household population, which is derived by subtracting the non-household population (column 3) from the total population (column 2). Column 5 shows the average Christian household size for each country. Column 6 shows the total number of Christian household units that resulted from dividing the total Christian household population (column 4) by the average Christian household size (column 5). Next, the regional total for the Christian household population (125,367,624) and total number of Christian households (29,574,715) were summed, respectively, which resulted in the average Christian household size for the Southern African sub-region:
Christian household size for Southern Africa = 121,606,595 / 29,574,715 = 4.1
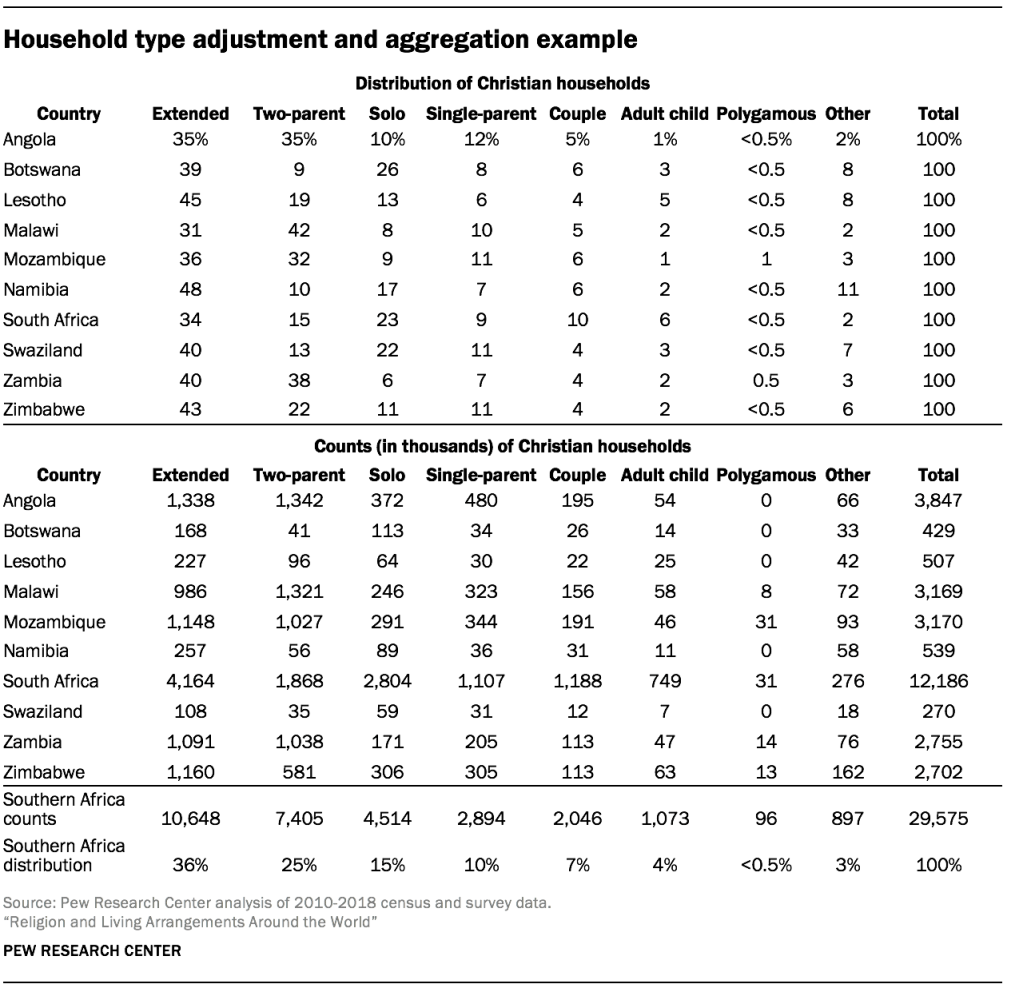
To illustrate how the data was weighted to derive household type at the aggregate levels, the next table also shows the 10 countries in the Southern African sub-region as an example.
The upper part of the table above shows the distribution of Christian households by country. Using the weighted total number of Christian households (column 6), the numbers of each type of household were derived by multiplying the total number by the percentage of each type for each country. The resulting numbers of each type of household for each country are shown in the lower part of the table. Then the regional total number of households was summed as well as the numbers for each type of household, which allowed for the computation of the Christian household type distribution for the sub-region (the bottom line): Among the Christian households in the Southern African sub-region, 15% are single-person households, 7% are couple households, 25% are two-parent households, 10% are single-parent households and 36% are extended-family households.
