
Note: For a 2023 analysis of how Americans view other religious groups, read “Americans Feel More Positive Than Negative About Jews, Mainline Protestants, Catholics.”
On the heels of a contentious election year in which partisan politics increasingly divided Americans, a new Pew Research Center survey finds that when it comes to religion, Americans generally express more positive feelings toward various religious groups today than they did just a few years ago. Asked to rate a variety of groups on a “feeling thermometer” ranging from 0 to 100, U.S. adults give nearly all groups warmer ratings than they did in a June 2014 Pew Research Center survey.
While Americans still feel coolest toward Muslims and atheists, mean ratings for these two groups increased from a somewhat chilly 40 and 41 degrees, respectively, to more neutral ratings of 48 and 50. Jews and Catholics continue to be among the groups that receive the warmest ratings – even warmer than in 2014.
Evangelical Christians, rated relatively warmly at 61 degrees, are the only group for which the mean rating did not change since the question was last asked in 2014. Americans’ feelings toward Mormons and Hindus have shifted from relatively neutral places on the thermometer to somewhat warmer ratings of 54 and 58, respectively. Ratings of Buddhists rose from 53 to 60. And mainline Protestants, whom respondents were not asked to rate in 2014, receive a warm rating of 65 in the new survey.
The increase in mean ratings is broad based. Warmer feelings are expressed by people in all the major religious groups analyzed, as well as by both Democrats and Republicans, men and women, and younger and older adults.
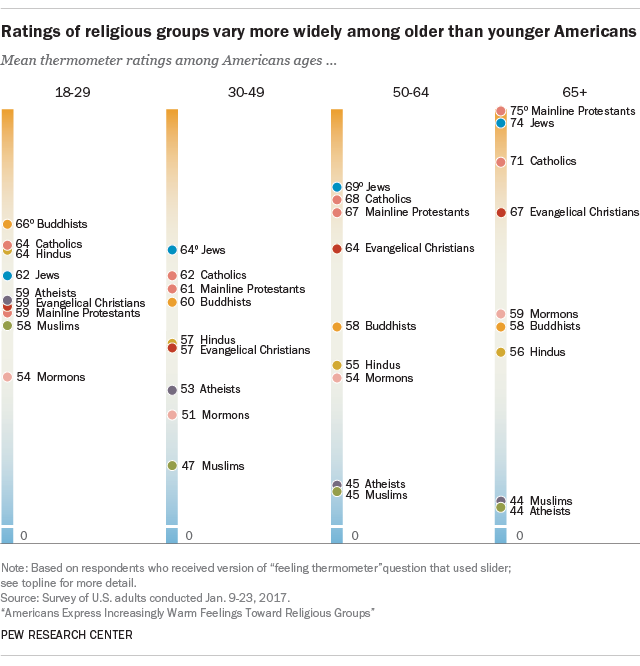
However, the mean ratings given to particular religious groups still vary widely depending on who is being asked. For example, young adults – those ages 18 to 29 – express warmer feelings toward Muslims than older Americans do. Moreover, young adults rate all of the groups in the study within a relatively tight range, from 54 degrees for Mormons to 66 for Buddhists. By contrast, older Americans (ages 65 and older) rate some religious groups, such as mainline Protestants (75) and Jews (74), very warmly, and others, such as Muslims and atheists (44 degrees each), much more coolly.
These are among the main findings of a new Pew Research Center survey of 4,248 adults conducted Jan. 9 to 23, 2017, on Pew Research Center’s nationally representative American Trends Panel. The survey also finds wide variation in the ratings that U.S. religious groups give one another. While for the most part Jews and Christians tend to rate each other warmly, atheists and evangelicals continue to view each other in a negative light.
Half of U.S. adults rate Jews, Catholics very warmly
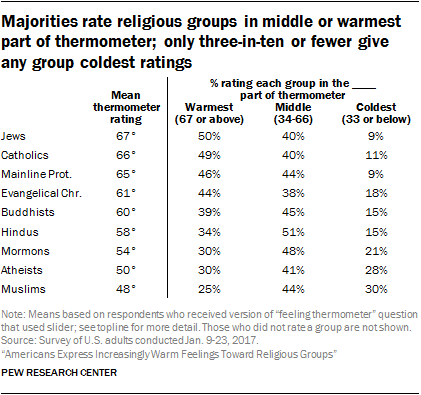
Americans express warm feelings toward Jews, with half of U.S. adults rating them at 67 degrees or higher on the 0-to-100 scale. Four-in-ten Americans rate Jews in the middle of the thermometer, between 34 and 66, and only about one-in-ten express feelings that fall at 33 degrees or cooler. These warm ratings are not significantly affected by the ratings of Jews themselves, because Jews make up just 2% of the U.S. adult population.
Similarly, about half of U.S. adults (49%) rate Catholics at 67 degrees or higher. But this does include a substantial share of respondents who are themselves Catholic, as Catholics make up roughly one-fifth of the adult population in the U.S. Looking only at non-Catholic respondents, 43% rate Catholics at 67 or higher on the thermometer and 44% place them in the middle range.
Just over four-in-ten Americans (44%) feel very warmly toward evangelical Christians, while 38% rate them in the middle of the thermometer and about one-in-five (18%) express cooler feelings toward this group. These ratings also include many people who consider themselves to be evangelical Christians (28% in the sample analyzed); once self-described evangelicals are excluded, a smaller share of non-evangelical U.S. adults (32%) rate evangelicals in the warmest third of the thermometer. (For more on how respondents rate religious groups other than their own, see the detailed tables that accompany this report.)
Pluralities of Americans give Buddhists, Hindus, Mormons, atheists and Muslims temperature ratings somewhere in the middle of the thermometer. Roughly equal shares rate atheists coldly (28%) as rate them warmly (30%). And slightly more Americans view Muslims in a negative light (30%) than a positive one (25%). Relatively few U.S. adults (9%) rate mainline Protestants (e.g., Episcopalians or United Methodists) coldly. The rest view this group either warmly (46%) or somewhat neutrally (44%).
Views of religious groups vary widely by religious affiliation, partisanship
Religious groups tend to rate their own group most positively. For example, Jewish respondents give Jews an average rating of 91 degrees on the 0-to-100 scale. Catholics rate their own group at a warm 83. And self-described atheists rate atheists at 82.
White evangelical Protestants rate evangelical Christians as a whole at 81 degrees, and white mainline Protestants rate mainline Protestants at 75. Black Protestants place both mainline Protestants and evangelical Christians in the mid to high 60s.
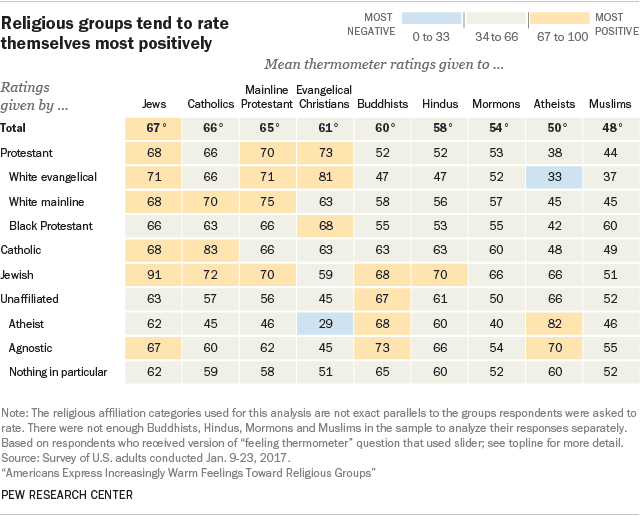
Religious groups’ views of each other range fairly widely. For the most part, Christians – including Protestants and Catholics – tend to rate other Christian groups in the warmer half of the thermometer. However, Protestants rate Mormons less warmly than they rate other Christian groups. Most groups rate Buddhists and Hindus fairly warmly, although white evangelical Protestants are one exception (they rate both of these groups at a more neutral 47 degrees). There are only two groups analyzed who give another group a mean rating of 33 or lower, and the chilly feelings are mutual: Atheists rate evangelical Christians at a cold 29 degrees, while white evangelical Protestants place atheists at 33. The two groups’ views of each other were also relatively cool in 2014, though white evangelical Protestants have warmed up slightly to atheists (from 25 to 33 degrees).
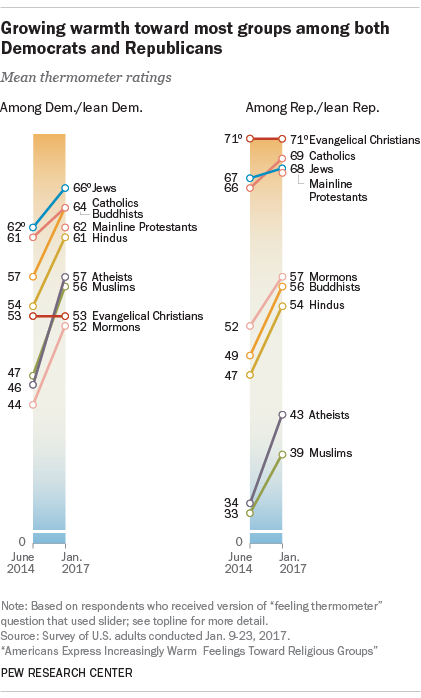
Both Democrats and Republicans now express warmer views toward a variety of groups than they did in June 2014, but large gaps remain between partisans in their views of a few of these groups. Democrats and those who lean toward the Democratic Party express somewhat warm feelings toward Muslims, giving them an average rating of 56 on the feeling thermometer, up from 47 in 2014. Republicans and those who lean Republican, meanwhile, rate Muslims at a much cooler 39 degrees, though this is up 6 degrees from 2014.
Similarly, Democrats rate atheists at 57, compared with a cooler rating of 43 toward atheists among Republicans. Partisans’ feelings also differ widely when it comes to evangelical Christians; Democrats rate evangelicals at a cooler temperature than either atheists or Muslims, at 53 degrees, while Republicans rate evangelicals among the warmest of any group mentioned in the survey, at 71 degrees.
As was the case in 2014, average ratings of religious groups currently vary more widely among Republicans – ranging from 39 for Muslims to 71 for evangelical Christians – than ratings among Democrats, which range from 52 for Mormons to 66 for Jews.
Education also is associated with varying views toward religious groups. Americans with college degrees give warmer ratings to most groups compared with those who have less education. Evangelical Christians are an exception to this pattern: College-educated adults view evangelicals somewhat less warmly (average of 57) than do those who are less educated (63).
All in all, there are relatively few differences by race and ethnicity in views toward religious groups, although black Americans view Muslims warmly (62) compared with how white (46) or Hispanic (49) Americans rate Muslims.
Knowing someone in a religious group associated with warmer feelings for that group
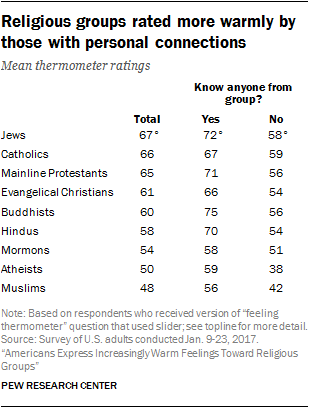
Across the board, Americans express warmer feelings toward religious groups when they are personally familiar with someone in the group, consistent with findings from the June 2014 survey. Those who do not know anyone who is Buddhist, for example, give Buddhists an average rating of 56 degrees on the feeling thermometer, compared with a much warmer 75 among those who do know a Buddhist. People who do not know atheists or Muslims rate these groups on the colder side of the scale, but those who do know someone who is an atheist or a Muslim rate these groups on the warmer side of 50.
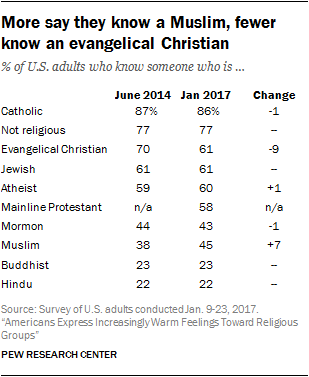
A large majority of Americans (86%) say they personally know someone who is Catholic, and three-quarters say they know someone who does not believe in or practice any religion. Roughly six-in-ten U.S. adults know someone who is Jewish, atheist, a mainline Protestant or an evangelical Christian. Comparatively, seven-in-ten Americans said they knew an evangelical Christian in June 2014.
Fewer than half of Americans say they personally know a Mormon (43%) or a Muslim (45%), though more Americans say they know a Muslim today than said this in June of 2014 (38%). Smaller shares say they know someone who is Buddhist (23%) or Hindu (22%).
The American Trends Panel survey methodology
The American Trends Panel (ATP), created by Pew Research Center, is a nationally representative panel of randomly selected U.S. adults recruited from landline and cellphone random-digit-dial surveys. Panelists participate via monthly self-administered web surveys. Panelists who do not have internet access are provided with a tablet and wireless internet connection. The panel is being managed by Abt SRBI.
Data in this report are drawn from the panel wave conducted Jan. 9 to Jan. 23, 2017, among 4,248 respondents. The margin of sampling error for the full sample of 4,248 respondents is plus or minus 2.5 percentage points. The analysis of the “feeling thermometer” questions is based on the 93% of respondents who received the slider version of the question (N=3,939; see topline for details), and the margin of sampling error for this subset is plus or minus 2.6 percentage points. Sample sizes and sampling errors for other subgroups are available upon request. In addition to sampling error, one should bear in mind that question wording and practical difficulties in conducting surveys can introduce error or bias into the findings of opinion polls.
Members of the American Trends Panel were recruited from two large, national landline and cellphone random-digit-dial (RDD) surveys conducted in English and Spanish. At the end of each survey, respondents were invited to join the panel. The first group of panelists was recruited from the 2014 Political Polarization and Typology Survey, conducted Jan. 23 to March 16, 2014. Of the 10,013 adults interviewed, 9,809 were invited to take part in the panel and a total of 5,338 agreed to participate.1 The second group of panelists was recruited from the 2015 Survey on Government, conducted Aug. 27 to Oct. 4, 2015. Of the 6,004 adults interviewed, all were invited to join the panel, and 2,976 agreed to participate.2
The ATP data were weighted in a multistep process that begins with a base weight incorporating the respondents’ original survey selection probability and the fact that in 2014 some panelists were subsampled for invitation to the panel. Next, an adjustment was made for the fact that the propensity to join the panel and remain an active panelist varied across different groups in the sample. The final step in the weighting uses an iterative technique that aligns the sample to population benchmarks on a number of dimensions. Gender, age, education, race, Hispanic origin and region parameters come from the U.S. Census Bureau’s 2015 American Community Survey. The county-level population density parameter (deciles) comes from the 2010 U.S. census. The telephone service benchmark comes from the January to June 2016 National Health Interview Survey and is projected to 2017. The volunteerism benchmark comes from the 2015 Current Population Survey Volunteer Supplement. The party affiliation benchmark is the average of the three most recent Pew Research Center general public telephone surveys. The internet access benchmark comes from the 2015 Pew Research Center Survey on Government. Respondents who did not previously have internet access are treated as not having internet access for weighting purposes. Sampling errors and statistical tests of significance take into account the effect of weighting. Interviews are conducted in both English and Spanish, but the Hispanic sample in the American Trends Panel is predominantly native born and English speaking.
The January 2017 wave had a response rate of 81% (4,248 responses among 5,268 individuals in the panel). Taking account of the combined, weighted response rate for the recruitment surveys (10.0%) and attrition from panel members who were removed at their request or for inactivity, the cumulative response rate for the wave is 2.7%. 3
© Pew Research Center, 2017


