Appendix A: 2012 National Survey of Latinos Methodology
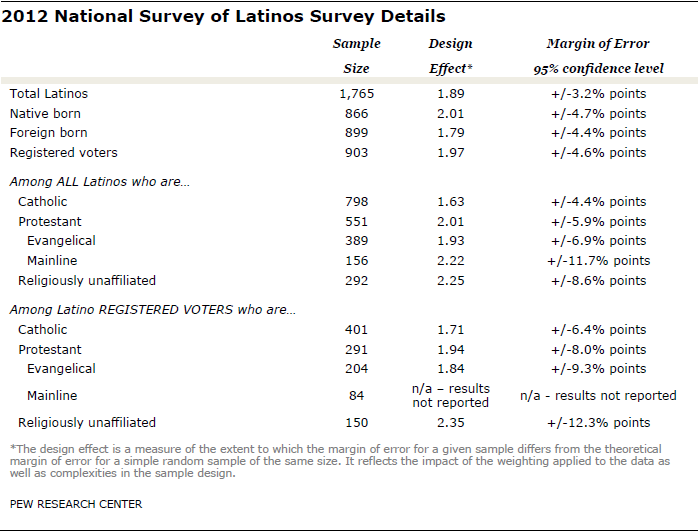
Results for this study are based on telephone interviews conducted from Sept. 7 through Oct. 4, 2012, by Social Science Research Solutions (SSRS), an independent research company, among a nationally representative sample of 1,765 Latino respondents ages 18 and older.
The survey included a main sample of 1,327 Latino respondents as well as an oversample of 438 non-Catholic Latinos; interviews were conducted with a total of 967 non-Catholics (529 from the main sample and 438 from the oversample). Respondents for the oversample were screened by asking them about their religion early in the survey. Respondents in the main sample were asked about their religion in Q67.

For the full sample, a total of 866 respondents were native born (including Puerto Rico), and 899 were foreign born (excluding Puerto Rico). Of the foreign born, 375 were U.S. citizens, 256 were legal residents, and 264 were neither U.S. citizens nor legal residents. For results based on the total sample, one can say with 95% confidence that the error attributable to sampling is plus or minus 3.2 percentage points.
For this survey, SSRS used a staff of Spanish-speaking interviewers who, when contacting a household, were able to offer respondents the option of completing the survey in Spanish or English. A total of 805 respondents (46%) were surveyed in Spanish, and 960 respondents (54%) were interviewed in English. Any person ages 18 or older of Latino origin or descent was eligible to complete the survey.
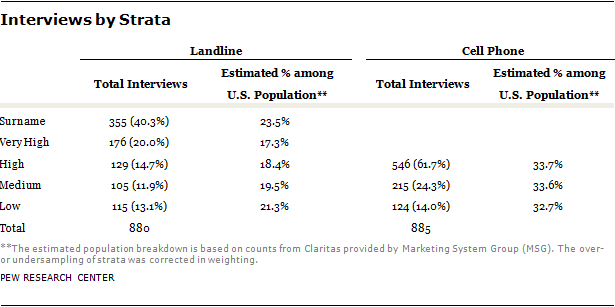
To ensure the highest possible coverage of the eligible population, the study employed a dual-frame landline/cell phone telephone design. The sample consisted of a landline component (yielding 880 completed interviews) and a cell phone component (885 interviews).2 Both the landline and cell phone components consisted of a stratified sampling design, oversampling areas with higher densities of Latino residents. The same sampling plan was used for the main sample and the non-Catholic oversample.

For the landline sampling frame, the sample was run against InfoUSA and other household databases, and phone numbers that matched to known Latino surnames were subdivided into a surname stratum. The remaining, unmatched and unlisted landline sample was divided into the following mutually exclusive strata, based on U.S. Census estimates of the density of the Hispanic population in each: Very High Latino, High Latino and Medium Latino.
Marketing System Group’s (MSG) GENESYS sample generation system was used to generate cell phone sample, which was divided into High and Medium Latino strata. Overall, the study employed eight strata.
Samples for the low-incidence landline and cell strata were drawn from previously interviewed respondents in SSRS’s weekly dual-frame Excel omnibus survey. Respondents who indicated they were Latino on the omnibus survey were eligible to be recontacted for the present survey. In addition, the incidences in the Very High and Medium landline strata of the non-Catholic oversample were lower than anticipated, so additional interviews with Latinos previously interviewed in Excel omnibus surveys were used to gather additional responses in these strata.3 Altogether, a total of 293 previously interviewed respondents (17%) were included in this sample.
It is important to note that the existence of a surname stratum does not mean the 2012 National Survey of Latinos was a surname sample design. The sample is RDD, with the randomly selected telephone numbers divided by whether they were found to be associated with or without a Spanish surname. This was done simply to increase the number of strata and thereby increase the ability to meet ethnic targets and ease administration by allowing for more effective assignment of interviewers and labor hours.
A five-stage weighting design was used to ensure an accurate representation of the national Hispanic population.
- An adjustment was made for all persons found to possess both a landline and a cell phone, as they were twice as likely to be sampled as were respondents who possessed only one phone type.
- The sample was corrected for a potential bias associated with recontacting previously interviewed respondents in certain strata.
- The sample was corrected for the likelihood of within-household selection, which depended upon the likelihood that the respondent’s age group would be selected, and within that age group, the particular respondent would be selected.
- The sample was corrected for the oversampling of telephone number exchanges known to have higher densities of Latinos and the corresponding undersampling of exchanges known to have lower densities of Latinos.
- Finally, the data were put through a post-stratification sample balancing routine. The post-stratification weighting utilized national 2012 estimates from the U.S. Census Bureau’s Current Population Survey, March Supplement, on gender, age, education, Census region, heritage, years in the U.S., phone status (i.e., cell phone only, cell phone mostly, mixed/landline only/landline mostly) and density of the Latino population.4 After the data were raked, the weighted data were used to determine the benchmark for a Catholic/non-Catholic parameter, which was used in the second stage of raking.
Footnotes:
2 According to calculations by the National Center for Health Statistics’ National Health Interview Survey (NHIS), from July to December 2011, 43.3% of Hispanic adults were living in wireless-only households and 17.0% were in wireless-mostly households. See Blumberg, Stephen J. and Julian V. Luke. 2012. “Wireless Substitution: Early Release of Estimates From the National Health Interview Survey, July-December 2011.” (return to text)
3 The supplemental Very High and Medium landline sample of respondents previously interviewed in Excel omnibus surveys were known to be Hispanics, but not necessarily to be non-Catholics; they were asked about their religion for the first time as part of the current study. (return to text)
4 The levels of cell phone only and cell phone mostly households within each ethnic group used were based on the most recent data available from the National Center for Health Statistics’ NHIS as shown in Blumberg and Luke (2012). (return to text)
Photo Credits: © Getty Images