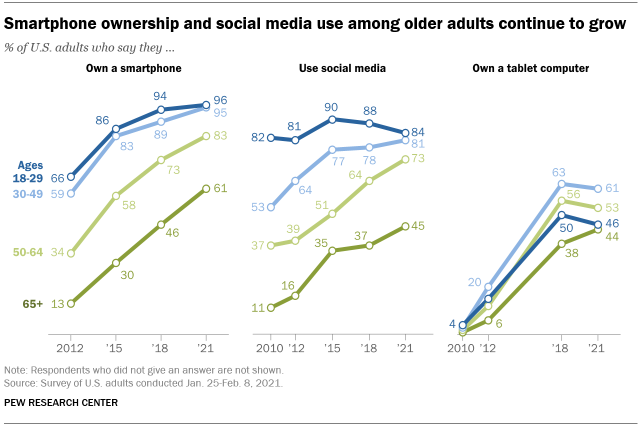
Younger adults are often more likely than their elders to be earlier adopters of innovations, and that has been true for many digital technologies since Pew Research Center began documenting their use. There are still notable differences in tech use between U.S. adults under 30 and those 65 and older. But on several fronts, adoption of key technologies by those in the oldest age group has grown markedly since about a decade ago, and the gap between the oldest and youngest adults has narrowed, according to new analysis of a Center survey conducted in 2021.
The survey found that 96% of those ages 18 to 29 own a smartphone compared with 61% of those 65 and older, a 35 percentage point difference. However, that gap has decreased from 53 points in 2012. The survey also showed that 95% of those ages 30 to 49 reported owning a smartphone in 2021 and 83% of those 50 to 64 said the same.
Pew Research Center has a history of studying digital technology adoption. For the new material in this report, the Center surveyed 1,502 U.S. adults from Jan. 25 to Feb. 8, 2021, by cellphone and landline phone. The survey was conducted by interviewers under the direction of Abt Associates and is weighted to be representative of the U.S. adult population by gender, race, ethnicity, education and other categories. Here are the questions used for this report, along with responses, and its methodology.
Similarly, those 65 and older also were the least likely to say they use social media sites like Facebook, Twitter or Instagram in the most recent survey. Some 45% reported using social media, compared with 84% of those ages 18 to 29 and 81% of those 30 to 49. At the same time, presence on social media among Americans 65 and older grew about fourfold since 2010, while use by the youngest adults remained relatively constant in that time frame. Since 2010, the gap between adults under 30 and adults 65 and older shrank from 71 points to 39 points.
Ownership of tablet computers is a somewhat different situation. Those ages 30 to 49 were the most likely people to own one in 2021. Roughly six-in-ten (61%) said they currently owned a tablet. That compares with 53% of those ages 50 to 64 who have a tablet, 46% of those 18 to 29 and 44% of those 65 and older.
When it comes to internet use, virtually all adults ages 18 to 29 now say they use the internet (99%). A similar share of those 30 to 49 (98%) say the same. And 96% of those 50 to 64 use the internet, compared with 75% of those 65 and older who report being internet users. In 2000, the gap between the oldest and youngest groups of adults in internet use was 56 percentage points; it now is 24 points. There are also gaps between older adults and some of their younger counterparts when it comes to home broadband: 64% of those ages 65 and older have such connections now, compared with 86% of those 30 to 49 and 79% of those 50 to 64. (The share of adults under 30 who have home broadband – 70% – is statistically similar to that for adults 65 and older.)
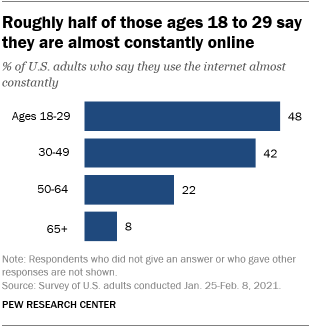
There are notable differences between age groups when measuring the frequency of internet use. Some 48% of those ages 18 to 29 said they were online “almost constantly,” compared with 22% of those 50 to 64 and 8% of those 65 and older.
Among sites and apps specifically asked about in the survey, YouTube tops the list in the share of adults using it, and the platform has gained traction among older adults. From 2019 to 2021, the share of Americans ages 50 to 64 who said they ever used YouTube increased from 70% to 83%. Among those 65 and older, YouTube use increased from 38% to 49% – gains of 13 and 11 points respectively. By contrast, the share of those using YouTube has remained fairly stable within younger age groups during the same period, with vast majorities saying they use the platform.
Note: Here are the questions used for this report, along with responses, and its methodology.


