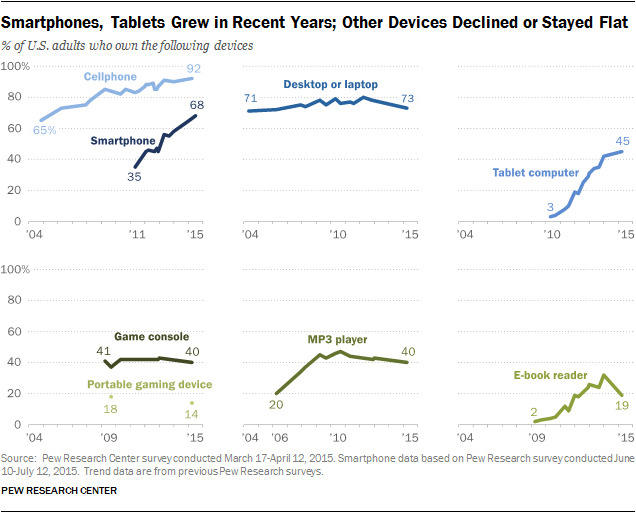
Today, 68% of U.S. adults have a smartphone, up from 35% in 2011, and tablet computer ownership has edged up to 45% among adults, according to newly released survey data from the Pew Research Center.1 Smartphone ownership is nearing the saturation point with some groups: 86% of those ages 18-29 have a smartphone, as do 83% of those ages 30-49 and 87% of those living in households earning $75,000 and up annually.
At the same time, the surveys suggest the adoption of some digital devices has slowed and even declined in recent years.

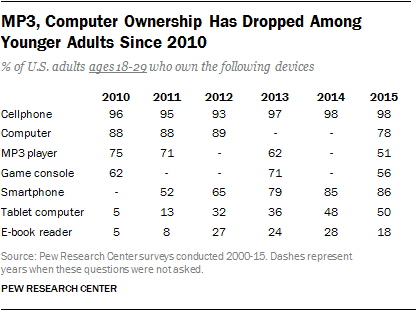
For example, e-reader device ownership has fallen. Today, about one-in-five adults (19%) report owning an e-reader, while in early 2014 that share was a third (32%). Ownership of MP3 players has not had a notable decline, but the percentage of adults who own one has hovered around the 40% mark since 2008. And computer ownership levels have stayed roughly where they were a decade ago. These changes are all taking place in a world where smartphones are transforming into all-purpose devices that can take the place of specialized technology, such as music players, e-book readers and gaming devices. Some of the changes in device ownership patterns are particularly evident for young adults. Among those ages 18-29, ownership of MP3 players and computers has declined by double digits in the past five years. In 2010, three-quarters of 18- to 29-year-olds owned an MP3 player; by 2015, only half (51%) had one.

There is a similar pattern with computer ownership. Today, 78% of adults under 30 own a laptop or desktop computer, compared with 88% who did so in 2010. Smartphone ownership, on the other hand, has surpassed both of these devices, with 86% of 18- to 29-year-olds owning one in 2015. In other words, as smartphones came to prominence several years ago, younger owners perhaps did not feel as much of a need as their older peers to have other kinds of devices.

The Pew Research Center surveys cover ownership of seven types of devices. The center studies them because their use often affects how people connect with each other, with information and with media. They also impact the way people spend their time. And each kind of device has its own attributes of how people use them and engage with the material they provide. Thus, device usage has notable social and cultural implications, and there are sometimes important political and macroeconomic consequences to the way people use their gadgets. For instance, every major media industry – those built around video, audio and text – has been disrupted by these devices.
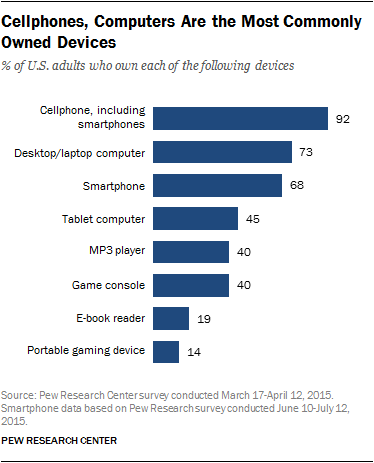
Cellphones continue to top of the list. Roughly nine-in-ten American adults (92%) own a mobile phone of some kind. Although these mobile devices are ubiquitous today, the share of adults who own one has risen substantially since 2004, when Pew Research conducted its first poll on cell ownership. At that time, 65% of Americans owned a cellphone.
Some of the other findings:
- Computers are the next-most popular device among those measured. Some 73% of U.S. adults own a desktop or laptop computer, a figure that is similar to the 71% of those who owned a computer or laptop in 2004 and down somewhat from a high of 80% in 2012.
- Some 40% of adults report having a game console, a number that has not budged in five years.
- Four-in-ten Americans (40%) own MP3 players, down from the high mark of 47% in 2010.
- About a fifth (19%) have e-book readers, a drop from 32% who said they owned one in early 2014.
- Some 14% of adults own a portable gaming device, such as a PlayStation Portable (PSP).
The analysis in this report is based mostly on telephone interviews conducted March 17 through April 12, 2015, among a national sample of 1,907 adults ages 18 and older living in all 50 U.S. states and the District of Columbia. Of these respondents, 672 were interviewed on a landline telephone, and 1,235 were interviewed on a cellphone, including 730 who had no landline telephone.
Of the full sample, 1,612 are internet users. The margin of sampling error for results based on the full sample is plus or minus 2.6 percentage points. Because many items were based on half samples, results based on internet users in this report have a margin of error of plus or minus 4.0 percentage points. Results based on smartphone owners come from a survey conducted between June 10 and July 12, 2015. They have a margin of error of plus or minus 3.1 percentage points. See the Methods section at the end of this report for more details.


