
Over the past two decades, Pew Research Center has regularly included Italy as part of its annual, cross-national poll known as the Global Attitudes Survey. Until recently, it was one of the few Western European countries where we continued to rely on face-to-face rather than phone interviews to conduct our nationally representative surveys. We hesitated to switch our data collection in Italy from face-to-face to phone due to concerns about population coverage, potential sample and measurement bias, and overall data quality.
We had the opportunity in the last few years to rigorously test and evaluate the use of phone survey methods in Italy thanks to two special, ad hoc projects that were not subject to our normally compressed international polling timeline or the constraints of adhering to longstanding trend questions. The first was a national poll about religious polarization; the second was a nationwide survey on media and politics. Together, these projects boosted our confidence in the sample representativeness of phone surveys in Italy. Moreover, they underscored the benefits of computer-assisted telephone interviewing, or CATI, including lower costs, improved quality control and more efficient project management — features we were eager to bring to our annual survey work in Italy. The key question was whether a shift in survey mode would significantly affect responses to core survey items and the analysis of long-established trends.
To assess mode effects in Italy, we conducted a “bridge survey” in June and July 2019 — simultaneously fielding identical questions and response options via both in-person and telephone interviews. This allowed us to contrast the two approaches and assess the implications for reporting time-series measures, some of which stretch back to 2002, essentially bridging the gap across measurement differences that are attributable to mode. The bridge survey further confirmed that phone surveys can accurately represent Italy’s entire population, but it also revealed differences in how people respond to questions over the phone as opposed to in person.
Background: The Global Attitudes Survey
Every year since 2002, the Center has fielded the Global Attitudes Survey, usually in around 20 to 40 countries per year. By design, this strategy allows for comparisons across countries and regions, as well as over time. One challenge in this type of comparative, cross-national analysis is the possibility that attitudes expressed by respondents may reflect elements of a survey’s design rather than actual changes in public opinion. Researchers need to be sensitive to changes in how a survey is administered.
Traditionally, the Global Attitudes Survey has interviewed Italians using face-to-face methods, with questions asked over time using the same verbiage and fieldwork adhering to similar data-quality standards from one year to the next. This approach gives us confidence that we can attribute differences in public opinion across years to actual changes in attitudes. A switch from asking respondents questions in person to calling them over the phone, however, is a significant shift in methods. This is why we decided to use a bridge survey to estimate what that change might mean for our measures of public opinion.
Our measures — namely the questions asked as part of the Global Attitudes Survey — generally focus on geopolitics, democracy and globalization, as well as other topical issues such as technology, gender and the media. Salient regional issues also may be included in specific countries to provide timely insights into current events and prominent figures. For example, the Global Attitudes Survey regularly asks people for their confidence in heads of state, but the leaders included in each questionnaire vary by region. In 2019, for example, we asked people in Asian countries about their confidence in Japan’s prime minister, while in Europe we asked about the Hungarian prime minister.
Differences in attitudes when asking in person versus by phone
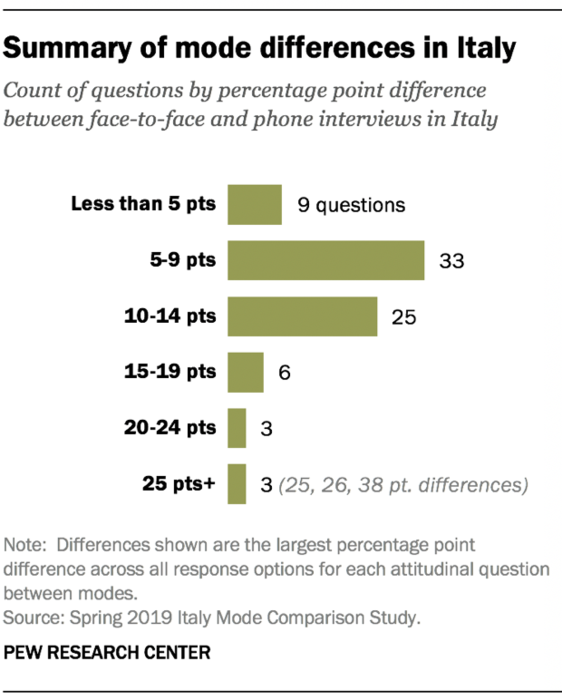
Our bridge survey included a total of 79 attitudinal questions. For each question, we analyzed and reported the percentage-point difference between face-to-face and phone estimates. For each question, we used the largest difference across all response options.
To summarize the findings broadly:
· Roughly half of the differences between questions (42 items out of 79, or 53%) were 9 points or less when comparing face-to-face and phone results. That included 17 items for which the difference was 5 points or less. (For this survey, achieving statistical significance at the 95% confidence level generally required a 6-point difference between the modes.)
· Among the 37 items with double-digit differences, 25 questions were 14 points or less.
· Six questions had differences of 20 points or more.
Many of the differences we observed in the bridge survey are related to these two features of the questionnaire’s design and its administration: the frequency of item nonresponse and whether “volunteered” responses were accepted.
All questions asked as part of the Global Attitudes Survey are voluntary, which means respondents can refuse to answer any item for any reason or say they don’t know enough to provide a response, which is known as item nonresponse. Item nonresponse was more likely to occur in person than on the phone, but in most cases the differences were relatively minor. For about three-quarters of the questions (58 of 79 items, or 73%), the item nonresponse difference between modes was 4 points or less, though there may have been larger differences across the substantive response options. This suggests that attitudinal differences across modes were not simply a function of item nonresponse differences.
Where we did find large differences in item nonresponse, we checked if these could be associated with significant net directional attitudinal shifts. We looked for a significant difference in only one overall direction — meaning there’s a statistically significant difference in the overall positive direction across modes (e.g., net confidence, approve or yes) but no significant difference in the negative direction (e.g., net no confidence, disapprove or no). We found that a majority of questions with statistically significant differences in nonresponse of 5 points or more (14 of 21 items, or 67%) also had an associated attitudinal difference between modes that was significantly different in one direction only, illustrating that larger rates of nonresponse might lead to meaningful shifts in attitudes for some questions.
Some questions in the Global Attitudes Survey also allow respondents to provide an answer that might not be explicitly offered by the interviewer. That’s what we refer to as a volunteered response. For instance, when asked to choose between two options, some respondents — usually a small share — may say that both (or neither) options are acceptable to them. In our bridge survey, 20% of the questionnaire (16 items) allowed for these additional volunteered responses. As we saw with item nonresponse, volunteered responses were more common with face-to-face interviews for each of these items, and in some cases these volunteered responses were associated with rather large discrepancies. The two questions with the largest differences across modes, in fact, were found within volunteered response options.
The following examples are illustrative of these two issues we encountered when comparing face-to-face and phone survey results.
Differential item nonresponse: The case of confidence in world leaders

In our spring 2019 questionnaire, we asked people in Italy about their confidence in six heads of state: French President Emmanuel Macron, German Chancellor Angela Merkel, Hungarian Prime Minister Viktor Orbán, Russian President Vladimir Putin, then-U.S. President Donald Trump and Chinese President Xi Jinping. For each leader, face-to-face respondents were more likely than phone respondents not to offer a response. These differences ranged from 4 points for Trump and Merkel to 24 points for Orbán.
These differences in item nonresponse by mode were sometimes associated with meaningful attitudinal differences, meaning that the net differences in the substantive findings were in one direction. In other cases, differences in item nonresponse did not seem to affect the attitudinal findings.
In the case of Xi, those interviewed in person were 13 percentage points more likely not to respond (22% vs. 9%), while phone respondents were 13 points more likely to express confidence in him (37% vs. 24%), illustrating a one-sided shift attributable to nonresponse.
Likewise, with confidence in Putin, face-to-face interviews were 6 points more likely than telephone interviewees not to offer an opinion, while phone respondents were 6 points more likely than in-person respondents to express confidence in the Russian leader (44% vs. 38%).
Things played out differently in the case of Orbán. Around four-in-ten face-to-face interviewees (39%) did not offer an opinion of the Hungarian prime minister, compared with only 15% of those interviewed by phone. But that 24-point difference was essentially evenly distributed into both confidence and no confidence ratings on the phone, maintaining the same 12-point net difference. In other words, the different levels of item nonresponse did not alter the prime minister’s net confidence rating: It was 37 percentage points both in the in-person interviews (49% no confidence vs. 12% confidence) and in the phone interviews (61% vs. 24%). This equal “redistribution” was the case with Macron as well, though more muted with a 7-point item nonresponse difference.
We saw generally similar patterns of differential item nonresponse by mode across our polling in other countries in 2019. For example, among all other European countries surveyed for our Global Attitudes Survey, item nonresponse for confidence in Xi ranged from 6 to 12 points for the six countries surveyed via phone, but from 29 to 51 points for the seven face-to-face countries.
Volunteered responses: The case of Italy’s relations with the U.S. and Russia
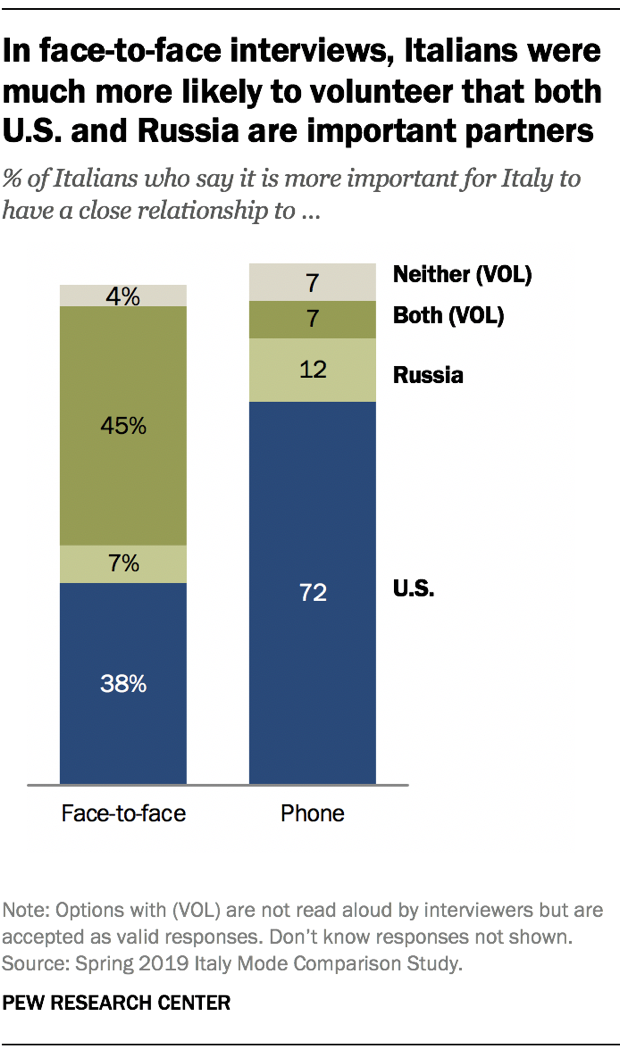
There were 16 questions in our bridge survey that accepted volunteered responses. The largest substantive difference across modes for five of these questions was the volunteered option, including the single largest difference in our study: a 38-point margin on a new question about Italy’s relationships with the United States and Russia.
When asking respondents whether it was more important for Italy to have a close relationship with the U.S. or Russia, we accepted two volunteered responses not provided by the interviewer: both relationships are equally important or neither are important. Overall, 49% of those surveyed face-to-face provided one of these volunteered answers while far fewer (14%) did so on the phone.
The greater use of the volunteered option has a substantial impact on how we understand Italians’ views of their bilateral priorities. In the face-to-face survey, 45% said both relationships are equally important, while 38% said a close relationship with the U.S. is more important. But on the phone, 72% said having a close relationship to the U.S. was more important, and only 7% said both.
Understanding our results
Overall, the bridge survey provided important insights into what might be expected when migrating from face-to-face to telephone surveys in Italy. The good news is that this project, along with previous Center studies, found sample respondents to be nationally representative across both modes. The more challenging issue was the impact on our measures of Italian public opinion.
While our experiment was not designed to test the precise causal mechanism driving the mode differences we found, prior methodological research on mode effects can help make sense of these results. For instance, there’s some evidence that interviewers may be better able to build rapport with respondents in person than over the phone. This greater trust and common understanding between respondents and interviewers can help explain the higher rates of item nonresponse and volunteered responses within the face-to-face context we found in our comparison. When speaking in person to an interviewer, respondents may be more comfortable to admit a lack of familiarity with a given subject (as in the case of the Hungarian prime minister) or to provide an answer that is not offered by the interviewer (as in the case of Italy’s relationships with the U.S. and Russia).
Other research suggests that respondents on the phone may be more likely to “satisfice” — that is, provide answers in a satisfactory but low-effort way — than during a face-to-face interview, which helps to explain lower rates of nonresponse on the phone but also lower rates of spontaneous, volunteered answers.
Conclusion
Overall, we found telephone surveys in Italy to be nationally representative and to have numerous benefits over face-to-face surveys, including lower costs, improved quality control and more efficient project management. All these factors can help inform our migration from in-person to telephone interviews in Italy for the Global Attitudes Survey. Transparent reporting of our mode shift, meanwhile, helps educate audiences to the meaning of changes in public opinion — that is, when differences are likely attributable to actual changes in attitudes and when they’re likely attributable to changes in methodology. Our bridge study was central to this goal, showing nontrivial differences by mode. In fact, 47% of our substantive questions had differences of 10 points or more across modes. This required us to think carefully about how we could mitigate differences due to changes in data collection in the future.
One strategy would be to consider changes to the survey instrument itself, such as reducing or potentially eliminating the number of volunteered responses. This would require recasting questions and response options so that interviewers read all responses previously deemed acceptable as volunteered, essentially eliminating any volunteered responses from the survey itself. This method would require appropriate responses to be known during questionnaire design, which may not always be possible. Of course, changing known volunteered response options from past surveys to explicit response options in future surveys may have unintended consequences which could compromise the over-time comparability.
In our own work, based on the results of this experiment, we’ve taken steps to reduce the number of questions accepting volunteered responses. In the Global Attitudes Survey we fielded in the summer of 2020, only 4% of items allowed volunteered responses. Likewise, only 4% of the questionnaire for our 2021 survey includes items accepting volunteered responses.
Whether it’s viable to switch modes in other countries in the future depends on a number of factors in addition to methodological considerations. These include research goals, practical issues of timing and costs, and in-country survey infrastructure and expertise. The global coronavirus pandemic is a reminder that some factors cannot be accounted for by even the most thoughtful planning.
In Italy, we were able to conduct our survey via phone as part of the last wave of the Global Attitudes Survey. With the bridge survey in hand, we had a sense of possible measurement differences from switching modes and the impact on longstanding trends — and we now have a better sense of the issues we may find in other contexts for mode migrations.


