Since the 1960s, household-income growth for African-Americans has outpaced that of whites. Median adjusted household income for blacks is now 59.2% that of whites, up slightly from 55.3% in 1967 (though in dollar terms the gap has widened).
But those gains haven’t led to any narrowing of the wealth gap between the races. In fact, after adjusting for inflation, the median net worth for black households in 2011 ($6,446) was lower than it was in 1984 ($7,150), while white households’ net worth was almost 11% higher. And as NYU researcher David Low noted in a recent working paper, high-earning married black households have, on average, less wealth than low-earning married white households.
[t]

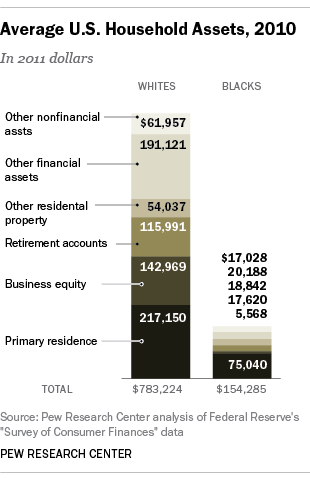
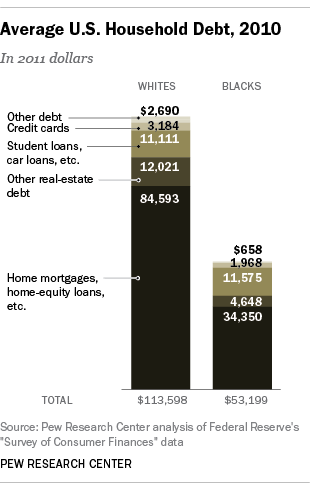
We decided to examine the differing compositions of black and white household wealth with data from the Federal Reserve’s triennial Survey of Consumer Finances. We looked at average asset ownership and debt levels, rather than medians, so we could see how much each component contributed to total net worth. (Bear in mind that averages are skewed by households at the top of the wealth distribution, and that the average for any given asset class includes households who don’t own those particular assets. Accordingly, these data say more about blacks and whites as groups than about the “typical” African-American or white household.)
Value of primary residence was the single biggest asset for both groups, but much more so for black households: On average, housing wealth accounted for 49% of black household assets, compared with 28% for the average white household. But the average home value was far lower for black households: $75,040 versus $217,150.
[ing]
Beyond housing, one striking difference between black and white household assets was the role of business ownership. Equity in businesses was the second-biggest asset class among white households, accounting for 18% of average assets, and grew 106% in value between 1983 and 2010. Among black households, however, business equity accounted for less than 4% of assets on average, and actually lost value between 1983 and 2010. After primary residence, the single biggest asset type for black households was “other residential property,” accounting for about 12% of average assets; but that asset class only grew 37% in value between 1983 and 2010.
Retirement accounts were the third-biggest asset class, on average, for both black and white households, and rose in value over the past three decades at similar rates. But black households, on average, started out with far less in their accounts: $1,496 in 1983, compared with $9,483 for white households.
The Brandeis researchers argue that, due to discriminatory employment patterns, “black workers predominate in fields that are least likely to have employer-based retirement plans and other benefits, such as administration and support and food services. As a result, wealth in black families tends to be close to what is needed to cover emergency savings while wealth in white families is well beyond the emergency threshold and can be saved or invested more readily.”
Average household debt rose steadily among both whites and blacks from 1983 to 2007. But while white households’ debt continued to rise between 2007 and 2010, to an average $113,598, it fell among black households over the same period, to an average $53,199 — mainly because of a decline in home mortgage debt. Overall, though, blacks continue to carry more debt relative to their household assets than do whites: 34.5% of average assets, versus 14.5% for white households.
