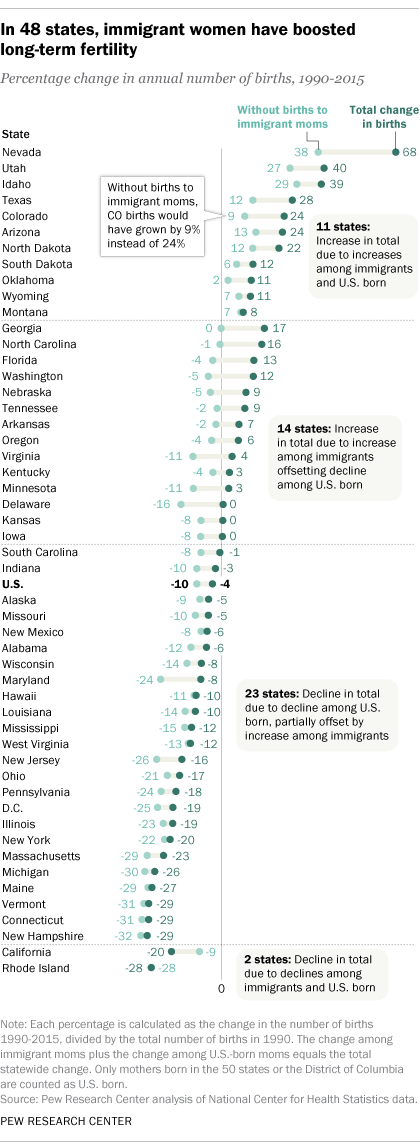
Immigrant women boosted the annual number of births nationwide and in all but two U.S. states – California and Rhode Island – between 1990 and 2015, according to a Pew Research Center analysis of National Center for Health Statistics data.

Nationally, the annual number of births declined 4% from 1990 to 2015 – the result of a 10% decline in total births attributable to U.S.-born women. This was partially offset by a 6% increase in total births attributable to immigrant women. In other words, without these births to foreign-born women, the total decline in annual U.S. births would have been more than twice as large.
There is wide variation among states in birth trends and in the relative impact foreign-born women have had on those trends. In some places, broader population shifts have played an important role: Nevada, for instance, experienced the largest increase in births of any state (68%), largely because the number of women of childbearing age – both U.S. and foreign born – more than doubled there. At the same time, many states with notable birth decreases, such as Rhode Island (-28%), have experienced declines in the number of women of childbearing age in recent decades.
In 11 states, the annual number of births grew from 1990 to 2015 as a result of increases in births among both U.S.-born and immigrant women. For example, Nevada’s overall increase in births included a 38% rise in total births accounted for by U.S.-born women and a 30% increase in births accounted for by immigrant women. In the absence of births to immigrant moms, growth in annual births in Nevada would have been substantially lower, though still quite robust (38%).
In 14 other states, the annual number of births increased from 1990 to 2015 solely because of births to immigrant mothers. In Washington, for instance, births increased 12% – the result of an 18% increase in total births attributable to immigrant women, which counteracted a 5% decline in total births attributable to U.S.-born women.
Another 23 states and the District of Columbia experienced overall birth declines because declining births among U.S.-born women were only partially offset by rising births among immigrant women. In Maryland, for instance, the share of all births accounted for by immigrant women rose 16%, but the share accounted for by U.S.-born women fell 24%, resulting in an overall decline of 8%.
Finally, in two states, annual births declined among both U.S.-born and immigrant women from 1990 to 2015. In California, the nation’s most populous state, a 20% overall decline resulted from an 11% decline in total births attributable to immigrant women and a 9% decline attributable to U.S.-born women. In Rhode Island, births decreased by 28%, driven mostly by among U.S.-born women, though births to immigrant mothers also declined, albeit very slightly (13 births).
One factor driving increases in births to foreign-born moms across the country is the rising number of immigrants in the U.S. population as a whole. In 1990, there were about 20 million immigrants in the U.S., and by 2015 that number had more than doubled to 43 million.
Increasing numbers of immigrants are only part of the story, however. Birth rates to immigrant women also remain markedly higher than those of U.S.-born women, despite the dramatic declines in immigrant birth rates that occurred in the wake of the Great Recession. As a result, immigrant women account for a disproportionate share of all births nationally: While 13% of all people in the U.S. were immigrants in 2015, 23% of all births were to immigrant women.

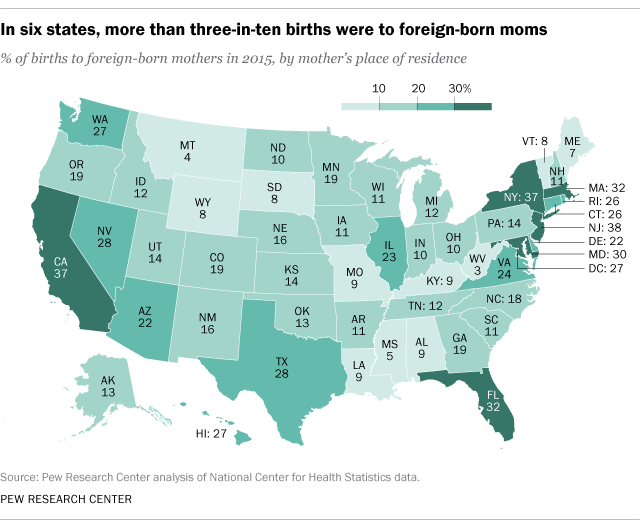
The share of births attributed to immigrant moms varies markedly from state to state, in part because immigrants are more highly concentrated in some states than others. More than one-third of all births to women living in New Jersey (38%), New York (37%) and California (37%) were to immigrant women in 2015, as were at least 30% of all births in Maryland, Massachusetts and Florida. At the other end of the spectrum, much smaller shares of births were to foreign-born women living in West Virginia (3%), Montana (4%) or Mississippi (5%).