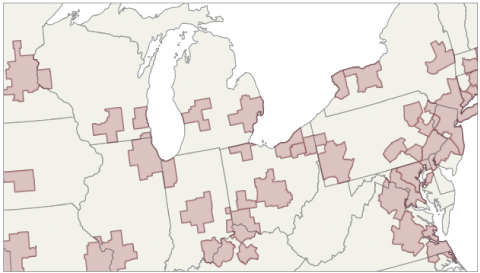
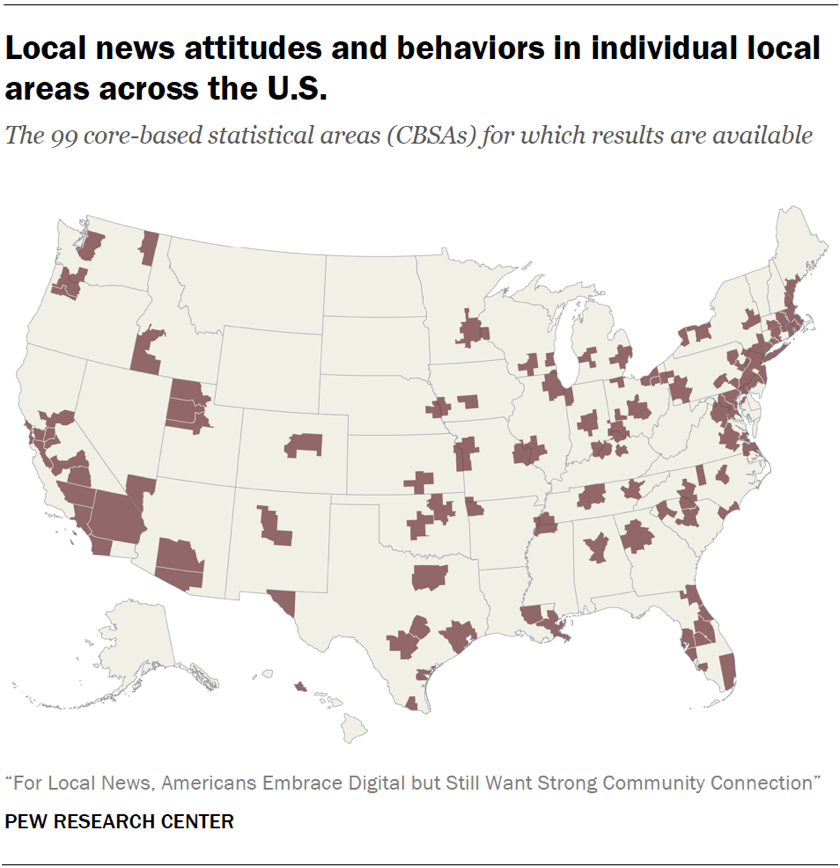
Local news is an integral part of American communities, providing information on everything from local politics and government to local sports and schools. A new Pew Research Center survey conducted Oct. 15-Nov. 8, 2018, among 34,897 U.S. adults examines how Americans get local news and their attitudes toward their local news media. In addition to results at the national level, the scope of the survey makes it possible to search for, examine and download findings about the local news environments of 99 distinct areas across the United States through an online, interactive feature.

Interactive: What are the local news dynamics in your city?
Explore detailed profiles of local news attitudes and behaviors across the U.S.
In the interactive, you can explore:
- What pathways (such as TV, social media or print) local residents use to get their local news, and what types of sources are used most often;
- How connected the local news media are to their community;
- How residents evaluate their local media on a number of key journalistic roles;
- What local news topics residents are most interested in; and
- How easy it is for them to get information on these topics.
For 31 local areas, the interactive also shows which specific sources each area’s residents named as their main source for local news.

These 99 local areas, defined by the U.S. federal government as core-based statistical areas (or CBSAs), can roughly be described as urban centers and their adjacent counties, such as San Antonio-New Braunfels, TX and Minneapolis-St. Paul-Bloomington, MN-WI.
If you live in an area with a smaller population, the interactive allows you to search for your own local city and see grouped results about local news habits and attitudes for areas similar to yours based on factors such as income, race and ethnicity, and voter turnout.
The estimates for these 99 individual CBSAs were produced using a method known as multilevel regression and poststratification (MRP), a statistical method designed to compute more precise estimates for small subgroups than is possible with conventional survey analysis techniques.
For more on how these modeled estimates were calculated, see the methodology that is part of the full report. You can also download a spreadsheet with each area’s results in the interactive.
