The coronavirus outbreak inflicted multiple disruptions on 2020 census operations this year, raising questions about how accurate the decennial count’s U.S. population statistics will be. The Census Bureau’s own data quality research will provide some answers, and the agency promised this month to expand that work with advice from outside experts.
The agency traditionally sponsors a broad program of self-evaluation of the once-a-decade national population count. This includes the release on Dec. 15 of its first major data quality product, called Demographic Analysis, which is a national population estimate and is an alternative to the official one the bureau will release from the census itself. This estimate is based mainly on government records about births, deaths, immigration and Medicare enrollment, similar to those used in the agency’s annual population estimates. One indicator of census quality will be whether Demographic Analysis results closely match those from the door-to-door census count.
The coronavirus outbreak and other disruptions to the 2020 census focused attention on potential impacts on the accuracy of the national population count. The goal of the U.S. census is to count everyone once, only once and in the right place.
The Census Bureau has a long tradition of self-evaluation, and it is expanding that research after questions about data quality were raised by government watchdog agencies (both Congress’ Government Accountability Office and the Commerce Department’s inspector general) and outside data users. Data quality metrics include those about census operations and about how final numbers compare with those from other reliable sources.
This blog post relies on past and current Census Bureau documents and presentations about its data quality research, as well as reports from other government agencies and an American Statistical Association task force focused on census quality.
Pew Research Center also has asked questions about census accuracy in surveys taken in February/March, June and November 2020. Everyone who took part is a member of the Center’s American Trends Panel (ATP), an online survey panel that is recruited through national, random sampling of residential addresses. This way nearly all U.S. adults have a chance of selection. The survey is weighted to be representative of the U.S. adult population by gender, race, ethnicity, partisan affiliation, education and other categories. Read more about the ATP’s methodology.
Here are the questions used for this report, along with responses, as well as its methodology.
Another measure of quality will come from release of additional data quality metrics from census operations for states and the nation in 2021, which will come earlier and in more detail than ever before in response to questions from government watchdogs and outside data users. A third quality measurement is the agency’s most closely watched data-quality product, a mini-census called the Post-Enumeration Survey, which won’t be fully released until 2022.
Assessing the data quality of the decennial census means evaluating the sources and methods of data collection (because some are better than others) as well as comparing the published statistics with alternatives based on population estimates or surveys. An accurate census is important because its statistics dictate how to apportion seats in the U.S. House of Representatives, guide the distribution of more than $1.5 trillion a year in federal funding and serve other important purposes.
The coronavirus outbreak hit just as census mailings began arriving at most U.S. households in March, and it was the first of many challenges to the census this year. In response, the bureau delayed operations to minimize face-to-face contacts, including its door-knocking effort to reach millions of households that had not responded. To complicate the collection challenges further, millions of Americans relocated, including college students whose campuses closed due to COVID-19. Many students were confused about where to be counted if they were living in a new home on Census Day. Hurricanes, wildfires and civil unrest in some areas added obstacles.
At first, the Trump administration asked Congress to delay legal deadlines to deliver data so the Census Bureau had more time to complete its work. But after the Senate did not act, the Census Bureau announced it would stick with the original deadlines, stopped collecting census responses as of Oct. 15 and announced a shortened schedule for checking and processing data. Congress’ Government Accountability Office raised concerns the compressed schedule could compromise data quality. Bureau officials recently acknowledged some data anomalies with the 2020 census data collection but said the issues are similar to those in past counts and were being addressed.
A Supreme Court ruling allowed the Census Bureau to stop counting, but a lawsuit from the National Urban League and others over the shortened census schedule is still pending. So is a separate case before the U.S. Supreme Court about whether the Trump administration would be allowed to exclude unauthorized immigrants from the statistics used to divide seats in Congress.
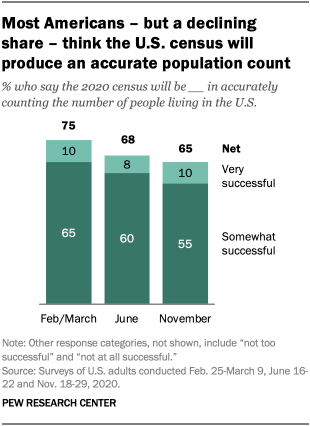
Despite these challenges, most Americans (65%) expect the census to be somewhat (55%) or very (10%) successful in producing an accurate national population count, according to a Pew Research Center survey in November. In June, 68% said so, as did 75% in a March survey.
Although there are some differences by age, race and ethnicity in assessing census accuracy, the most recent survey finds about six-in-ten adults in each major demographic group say the census will be somewhat or very accurate in counting the population. There are no differences by political party.
The Census Bureau’s first look at 2020 census data quality
The Census Bureau Demographic Analysis estimate will include a low, middle and high range of national population estimates by age, sex, race and Hispanic origin, though they can’t be used for quality assessment purposes until the Census Bureau produces final 2020 census statistics. The bureau has announced there will be delays in release dates of the 2020 population count, though specific dates have not been disclosed. The total U.S. population number from the 2020 census, originally due Dec. 31, is instead expected in early 2021, along with state population figures that are used to apportion seats in the U.S. House of Representatives. Roughly three months later, overall U.S. and state race and Hispanic origin statistics are expected to be published as part of the bureau’s redistricting file, with breakdowns by age and sex to follow later.
How does the Census Bureau evaluate census quality?
Population counts need to be accurate because their uses include steering the distribution of political power and government resources. Here are three ways the Census Bureau measures its own census accuracy.
How well did census operations go?
- A key measure is the share of households that self-responded – answered on their own without a census worker coming to the door. The 1960 census was the first in which most households were asked to complete their own questionnaires.
Do census numbers agree with alternative population estimates?
- Demographic Analysis uses government records about births, deaths, immigration and Medicare enrollment to build a U.S. population estimate as of April 1, 2020, Census Day. When census statistics are released next year, we’ll see how well they match up. Demographic Analysis has been used to evaluate every census since 1950.
How many people are missed or double-counted?
- The Census Bureau conducts a sample survey of 188,000 U.S. housing units, called the Post-Enumeration Survey (also called Dual-System Estimation), which asks the same questions the census does. Then it matches each case with census records to determine how many people – and in which demographic groups – were omitted or counted twice. This technique has been used in the census since 1950.
Census officials producing the Demographic Analysis estimate began with government records, then dealt with missing or incorrect data by pursuing additional research and consulting outside experts. For example, they accounted for different ways that race has been recorded on birth records in different decades, assessed the impact out-migration had on Puerto Rico’s population after Hurricane Maria in 2017 and filtered out a large number of Medicare records for people implausibly ages 115 and older.
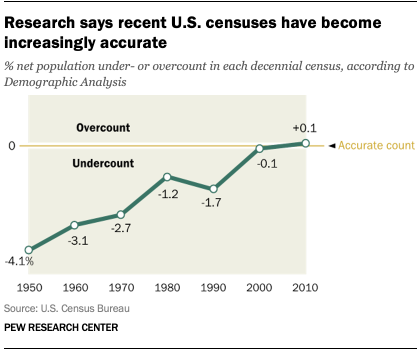
In the last census, the 2010 total population count of 308,746,000 closely matched the middle estimate of 308,475,000 from Demographic Analysis, continuing a generally improving trend of accuracy in recent decades. However, Demographic Analysis also found that the census continued to undercount some groups, missing nearly 1 million Black Americans and potentially more than 1 million children while counting some people more than once.
Other quality indicators for census data to be released soon
Data users outside the Census Bureau, including a task force convened by the American Statistical Association, have pressed for quick release of additional detailed quality indicators. Responding to that, the Census Bureau announced that when the congressional apportionment count is released, the agency also will publish for the first time details about how the population count was collected in each state. The bureau also committed to working with outside experts who will review its quality assessment plans.
This additional detail is relevant because census information of all kinds varies in quality depending on the method used to collect it. The most accurate source, according to Census Bureau research, is information that people give about themselves when they complete their census forms. A good sign is that the 2020 census self-response rate – 67.0% – is slightly higher than 2010’s 66.5%. Data collected by census workers in interviews with households that didn’t return their forms is somewhat less accurate but is higher quality on average than information gathered from a neighbor or other “proxy,” in census jargon. The least desirable information comes when the bureau has no information or only partial information about a household, and fills in details about it using a statistical technique called imputation, in which the bureau estimates the number and characteristics of people living at an address in question. More so in 2020 than in the past, the bureau sometimes used data from government records, such as Social Security files, when it could not contact a knowledgeable person.
Census officials say preliminary analysis shows that proxy rates in 2020 are similar to 2010, though higher in college towns. But their early analysis also found lower quality on another metric: completeness of responses. Compared with 2010, a higher share of questions came back blank, and they are not sure why. Census statisticians will use established procedures to fill in the missing data, but that information is on average less accurate than if it had come from the person filling out the form.
Post-enumeration survey is underway
The agency’s most respected quality metric is a smaller-scale census of 188,000 housing units in U.S. states, the District of Columbia and Puerto Rico, called the Post-Enumeration Survey. The survey, which is underway now, will match its case-by-case sample results against actual 2020 census records, a technique known as dual-system enumeration. Results, extrapolated to the full population, will show which demographic groups were missed, miscounted or double-counted in the full census of more than 140 million housing units.
The survey got its start in 1950 after research found that more young men signed up for the draft in World War II than were counted in the 1940 census, according to Census Bureau officials. The Post-Enumeration Survey only counts people in households, so it doesn’t measure the quality of information about those in group quarters such as college dormitories and prisons.
The 2010 census was overall quite accurate, according to the Post-Enumeration Survey. It overcounted the population by 36,000 people, which was not statistically different from zero. However, the count also missed millions of people and double-counted others, with the errors canceling each other out. While Demographic Analysis can provide net overcounts or undercounts, the Post-Enumeration Survey looks under the hood to show how many people (and from which demographic groups) were missed or counted erroneously.
Note: Here are the questions used for this report, along with responses, as well as its methodology.


