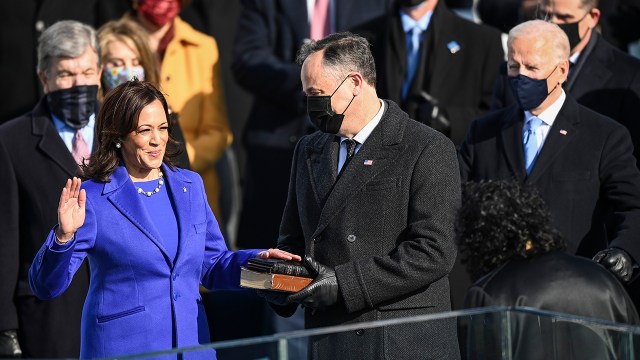
The swearing-in of Kamala Harris as the vice president of the United States marked several important “firsts”: She became the first female vice president, as well as the first Black person and first Asian American to hold that office. But her ascendance to the second-highest office in the land represented so much more. It held up a mirror to America, revealing how key demographic trends have reshaped the country.
Kamala Harris embodies several trends that have been unfolding gradually over recent decades. As a result, many Americans – not just women of color – can see themselves in her story.
The rise in multiracial Americans: Harris has a multiracial background. Her mother was South Asian and her father is Black. According to the U.S. Census Bureau, Americans who identify as two or more races are one of the fastest growing racial or ethnic groups in the country, along with Asians. Roughly 6.3 million American adults – 2.5% of the adult population – identified as being more than one race in 2019. The number has grown significantly since the census first allowed people to choose more than one racial category to describe themselves in 2000. Among adults who identify as more than one race, relatively few (2.1%) are Black and Asian.
Racial identity is complex, and estimates of the multiracial population may underrepresent the share of people who identify with multiple racial groups based on their family history. In addition, racial identity can be fluid and may change over the course of one’s lifetime. In a 2015 Pew Research Center survey, about three-in-ten adults with a multiracial background said the way they describe their race has changed over the years – either from seeing themselves as multiracial at one point and single race at another, or vice versa.
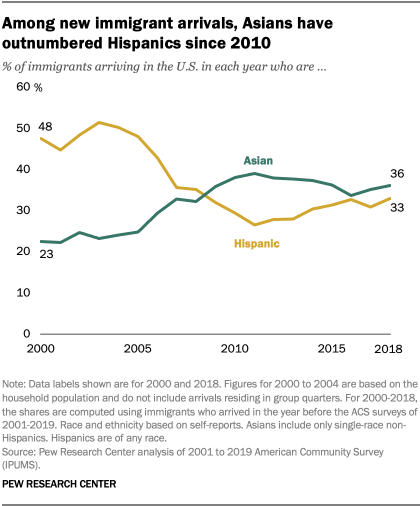
Growing waves of immigrants are from Asia and the Caribbean: Harris is the daughter of two immigrants, one from India and one from Jamaica. The share of immigrants from Asia living in the U.S. has been on the rise in recent decades, following the passage of the 1965 Immigration and Nationality Act. In 2018, Asians made up 28% of the U.S. foreign-born population, up from 4% in 1960. And starting as early as 2010, Asian immigrants outnumbered Hispanic immigrants among new arrivals.
Harris’ father immigrated to the U.S. in 1961 from Jamaica. There were roughly 125,000 Black immigrants in the U.S. at that time, but their numbers have grown steadily, particularly in the last two decades. By 2019, one-in-ten Black people living in the U.S. were foreign born. That same year, Jamaica was the top birthplace for Black immigrants.
As a second-generation American, Harris is among the roughly 25 million U.S. adults who are children of immigrants. This group represents about 10% of the adult population.
The rise of intermarriage: Harris’ husband, Doug Emhoff, is White, which makes them – as a couple – part of a growing group of intermarried couples. In 2019, 11% of all married U.S. adults had a spouse who was a different race or ethnicity from them, up from 3% in 1967. Among newlyweds in 2019, roughly one-in-five (19%) were intermarried.
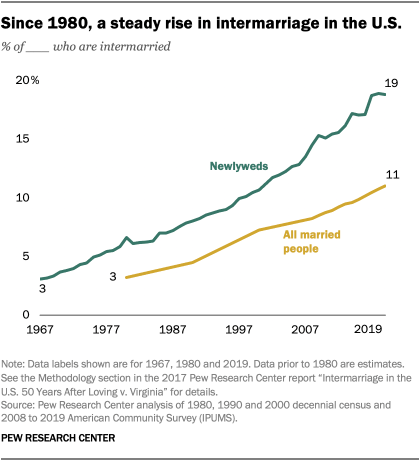
The rise of intermarriage was driven initially by legal changes: The 1967 U.S. Supreme Court decision in Loving v. Virginia ruled that marriage across racial lines was legal throughout the country. Demographic trends have contributed as well – in particular, the growing share of the population that is Asian or Hispanic, as these groups are more likely than others to marry someone of another race or ethnicity. As of 2015, the largest share of intermarried couples include one Hispanic and one White spouse. Some 15% are White and Asian, 12% are White and multiracial and 11% are White and Black.
In addition, public attitudes about intermarriage have evolved. The public has become more accepting of mixed marriages. In 2017, 39% of all adults said the growing number of people marrying someone of a different race is a good thing for the country, up from 24% in 2010.
Divorce and blended families: When she married Emhoff – who is divorced and has two children from his previous marriage – Harris became part of a blended family. The American family has evolved considerably in recent decades, and today there is no typical “family.” In 1980, most children younger than 18 lived in a household with two married parents who were in their first marriage. By 2014, fewer than half of U.S. children lived in that type of household. Some 15% lived with parents in a remarriage, 7% lived with cohabiting parents and 26% lived with an unpartnered parent.
Trends in divorce and remarriage have contributed to the increasing diversity of family types. The divorce rate for U.S. adults ages 50 and older has roughly doubled since the 1990s. At the same time, divorce has become less common for younger adults who are delaying marriage until later in life. In 2015, for every 1,000 married adults ages 50 and older, 10 had divorced.
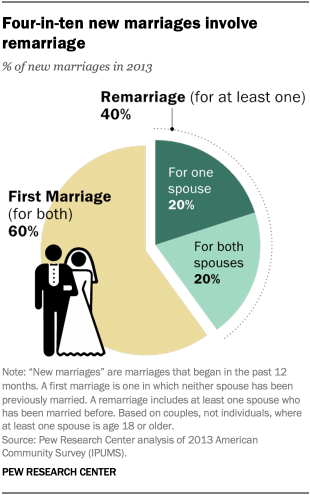
Remarriage is also on the rise. In 2013, four-in-ten new marriages in the U.S. included at least one partner who had been married before. This marked a significant increase from past decades, fueled in large part by rising divorce rates and the overall aging of the U.S. population, which gives people more years to form – and dissolve – marital unions.
Childlessness: Harris does not have any biological children of her own. A look at U.S. women at the end of their childbearing years reveals that 15% were childless in 2014, while the majority (85%) had given birth to at least one child. The childlessness rate was down from 20% in 2005 but still higher than the rate prior to the 1990s.
Higher levels of education are associated with higher rates of childlessness. In 2014, only 7% of women ages 40 to 44 without a high school diploma were childless. This compares with 13% of those who completed high school or attended some college, and about 20% of those with a bachelor’s degree or more education.
Delayed marriage: Harris married when she was 49 years old, and while this is older than the median age at first marriage, it reflects a trend toward women and men waiting longer to get married. In 2020, the U.S. had its highest median age at first marriage on record – 28.1 for women and 30.5 for men. These numbers have crept up steadily over time. In 2000, the median age at first marriage was 25.1 for women and 26.8 for men. In 1980, the median ages were 22.0 for women and 24.7 for men.
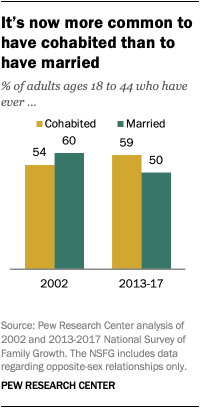
One reason for the uptick in delayed marriage is a rise in cohabitation among Americans. A 2019 Pew Research Center analysis found that the share of adults ages 18 to 44 who have ever cohabited (59%) was higher than the share who had ever been married (50%). This represented a reversal of sorts from 2002, when more adults had been married (60%) than had ever cohabited (54%).
At the same time, relatively few adults view marriage as central to a person’s happiness. In 2019, only 17% of adults said being married was essential for a woman to live a fulfilling life, and a similar share (16%) said the same about a man. Having a job or career they enjoy is viewed as essential for women and men to live fulfilling lives by much larger shares of the public (46% and 57% respectively). Still, a majority of never-married adults said in a 2017 survey that they wanted to get married someday.
Interfaith marriage: Harris and Emhoff are among a growing share of married adults whose spouse does not share their religion. Harris is Christian and attends a Baptist church, and Emhoff is Jewish. While most married adults in the U.S. have a spouse who is the same religion as them, that has become less common in recent decades. Among adults who were married before 1960 (and are still married), only 19% have a spouse who does not share their religion. For those married in the 1980s and ’90s, 30% are in an interfaith marriage. The share has continued to rise: 39% of adults who were married between 2010 and 2014 have a spouse who identifies with a different religious group than their own.
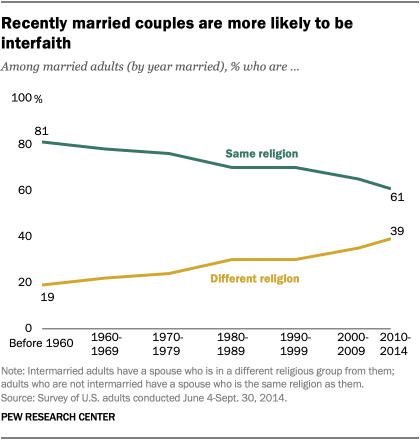
The most common interfaith marriages involve Christians who are either married to a spouse from a different Christian tradition or Christians who are married to an unaffiliated spouse. The share who are married to someone from a different faith (such as Harris and Emhoff) is smaller but still growing.
Women in leadership: Before becoming the first female vice president, Harris served as a U.S. senator. Elected in 2016, Harris joined 20 other women in the U.S. Senate in 2017. This marked a historic high for women; the number rose to 25 in 2019. Now, the Senate has 24 female members, including one Latina woman and two who are Asian-Pacific Islander. There are no Black women currently serving in the Senate. In the House of Representatives, women make up 27.3% of current members. This represents a historic high for that chamber.
While women have made significant gains in leadership positions in recent decades, they still hold a relatively small share of top leadership positions in politics and in business. Women hold only nine of the nation’s governorships. They were 7.4% of Fortune 500 CEOs in 2020 and 27% of Fortune 500 board members in 2019.
For their part, most Americans say they would like to see more women in top leadership positions, and majorities see women and men as equally capable across key dimensions of leadership. Still, most men and women say it’s generally easier for men to get elected to high political office and to get top executive positions in business.
Educational gains for women: Kamala Harris is a highly educated woman. She has a bachelor’s degree and a law degree. Her achievements in this area are emblematic of a generation of women who have surpassed men in terms of educational attainment. In 2019, among those ages 25 and older, 37% of women and 35% of men had completed four years of college.
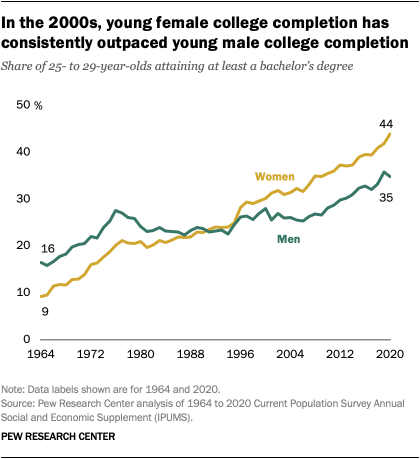
Looking at young adults, the gender gap in favor of women is much wider, reflecting recent gains. In 2020, 44% of women ages 25 to 29 had at least a bachelor’s degree, compared with 35% of men in the same age group. Young women surpassed young men in college completion for the first time in 1991. Since then the gender gap has steadily grown. Today, young women are more likely than young men to have completed a four-year college degree across all major racial and ethnic groups.
Women also make up the majority of enrolled law school students. In 2020, 55% of those enrolled in U.S. law schools were women, while 45% were men. Women are represented in larger shares among White law students as well as students from racial and ethnic minority groups.
