The U.S. Asian population is diverse. A record 22 million Asian Americans trace their roots to more than 20 countries in East and Southeast Asia and the Indian subcontinent, each with unique histories, cultures, languages and other characteristics.
The 19 largest Asian origin groups in the United States together account for 97% of the nation’s total Asian population. Below are key findings about these Americans. (This analysis includes all those who identify their race as Asian alone or as part of a multiracial background, regardless of Hispanic origin. It is accompanied by updated fact sheets that describe key demographic and economic characteristics of each of Asian origin group, as well as by another analysis that details the diversity of origins within the Asian American population.)
This analysis and the accompanying fact sheets about the Asian population in the United States combine the latest data available from multiple sources. The main source used is a three-year dataset constructed from the U.S. Census Bureau’s 2017-2019 American Community Survey’s public-use files obtained from the Integrated Public Use Microdata Series (IPUMS). The ACS is used to present demographic and economic characteristics for each group. Additional data on population estimates were obtained from the Census Bureau’s 2012 report, “The Asian Population: 2010” (2000 and 2010) and tables available through Census Bureau data. Population projection figures are from the Census Bureau’s 2017 population projections.
Population estimates for specific Asian groups include mixed-race and mixed-Asian group populations, regardless of Hispanic origin. As a result, there is some overlap in the numbers for the individual Asian groups because people with origins in more than one group are counted in each group to which they belong. For example, an individual identifying as “Chinese and Filipino” would be included in the totals for all Chinese and all Filipinos.
All data was collected before the COVID-19 pandemic.
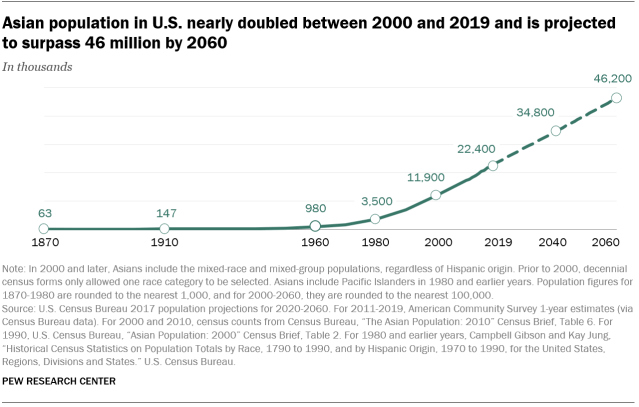
The U.S. Asian population is projected to reach 46 million by 2060. In the 1870 census, roughly 63,000 individuals were classified as Asian by U.S. Census Bureau enumerators. By 1960, the first time census respondents could choose their own race, 980,000 individuals self-identified as Asian. The nation’s Asian population rose to 11.9 million by 2000 and then nearly doubled to 22.4 million by 2019 – an 88% increase within two decades. Asians now make up about 7% of the nation’s overall population, and their numbers are projected to surpass 46 million by 2060, nearly four times their current total. (In decennial censuses conducted in 1980 and earlier, Asian Americans and Pacific Islanders were reported as a single group.)
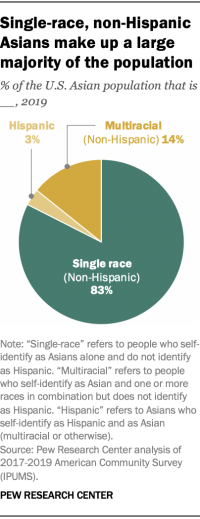
The single-race, non-Hispanic segment of the U.S. Asian population makes up a large majority (83%) of all Asians in the country. This population is also the nation’s fastest-growing racial or ethnic group. Between 2000 and 2019, their numbers grew by 81%, outpacing a 70% increase among Hispanics. The Black population grew by 20% during this span, while there was virtually no change in the White population.
Multiracial and Hispanic Asians comprise 14% and 3% of the Asian population in the U.S., respectively. Those who identify as Asian and White make up a large majority (70%) of non-Hispanic multiracial Asians. Of the 19 origin groups included in this analysis, Japanese Americans are most likely to identify as multiracial non-Hispanic (32% do so). Around one-in-five Filipinos (18%) and 15% of Koreans also identify as multiracial non-Hispanic.
Asian Hispanics, meanwhile, are the smallest segment of the nation’s Asian population. A 34% plurality of this group are Filipino.
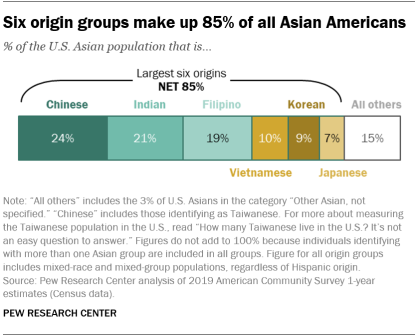
Chinese Americans are the largest Asian origin group in the U.S., making up 24% of the Asian population, or 5.4 million people. The next two largest origin groups are Indian Americans, who account for 21% of the total (4.6 million people), and Filipinos, who account for 19% (or 4.2 million people). Those with roots in Vietnam (2.2 million), Korea (1.9 million) and Japan (1.5 million) each have a population of at least 1 million. The other 13 groups in this analysis account for 12% of all U.S. Asians, totaling 2.7 million people, with no one group surpassing 600,000. The remaining 3% of U.S. Asians provided other origins or indicated they are Asian but did not indicate a specific origin.
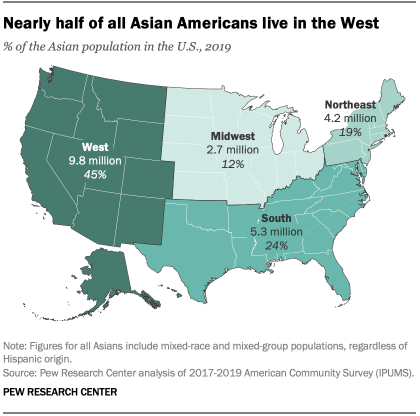
Nearly half of U.S. Asians (45%) live in the West, with nearly a third (30%) in California alone. California had an Asian population of roughly 6.7 million in 2019, by far the nation’s largest. It was followed by New York (1.9 million), Texas (1.6 million), New Jersey (958,000) and Washington (852,000). A majority of U.S. Asians (55%) lived in these five states.
Aside from Hawaii, where U.S. Asians accounted for 57% of the population in 2019, Asians made up the largest share of the overall population in California (17%), Washington (11%), New Jersey (11%) and Nevada (11%).
While a plurality of Asian Americans lived in the West in 2019, some 24% lived in the South, 19% in the Northeast and 12% in the Midwest.
Around six-in-ten Asian Americans (57%), including 71% of Asian American adults, were born in another country. By comparison, 14% of all Americans – and 17% of adults – were born elsewhere.
The modern immigration wave from Asia has accounted for a quarter of all immigrants who have arrived in the U.S. since 1965. But when and how Asian immigrants arrived in the U.S. varies, which helps explain why some Asian origin groups are more likely than others to be U.S. born. For example, immigrants account for only 27% of Japanese Americans, who began arriving in the 19th century as plantation workers in what is now the state of Hawaii. By contrast, many Bhutanese arrived recently as refugees, and a large majority (85%) are foreign born.
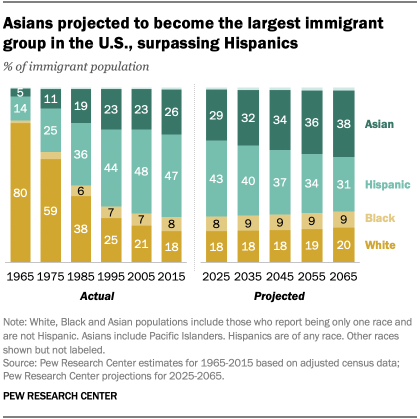
Asian Americans are projected to be the nation’s largest immigrant group by the middle of the century. Single-race, non-Hispanic Asians are projected to become the largest immigrant group in the country, surpassing Hispanics in 2055. By then, Asians are expected to make up 36% of all U.S. immigrants, while Hispanics will make up 34%, according to population projections from the Pew Research Center.
People from Asia made up about 14% of the 10.5 million unauthorized immigrants in the U.S. in 2017. Four nations in Asia were among the top 15 countries of birth for U.S. unauthorized immigrants: India (525,000), China (375,000), the Philippines (160,000) and Korea (150,000).
U.S.-born Asians are substantially younger than the rest of the Asian American population. As of 2019, the Asian population in the U.S. had a median age of 34, slightly lower than the nation’s overall median of 38. But the median age of U.S.-born Asians was just 19 – compared with 36 among all U.S.-born people. Foreign-born Asians, meanwhile, had the same median age as the nation’s overall immigrant population (45).
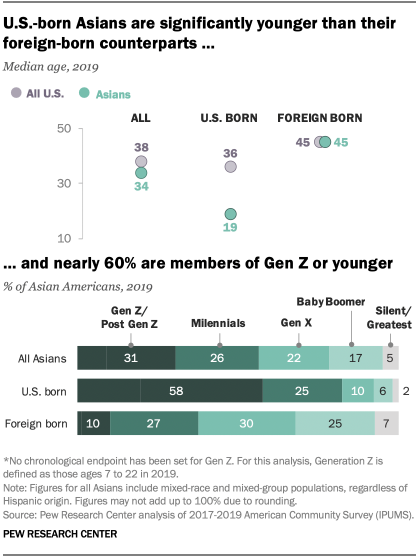
The relative youth of the U.S.-born Asian population is reflected in their generational breakdown. Nearly six-in-ten U.S.-born Asians (58%) were members of Generation Z in 2019, which means they were 22 or younger at the time. Another quarter of the U.S.-born Asian population that year belonged to the Millennial generation, while one-in-ten or fewer were part of Generation X or older generations.
Overall, 72% of all U.S. Asians were “proficient” in English as of 2019, meaning they either spoke only English or spoke the language very well. Nearly all U.S.-born Asians (95%) were proficient in English, compared with 57% of foreign-born Asians.
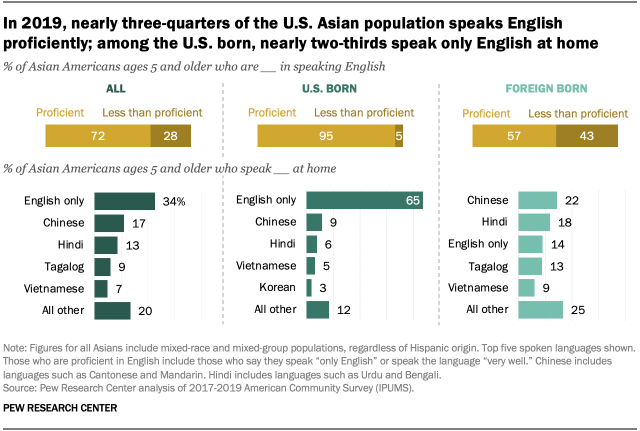
About a third of U.S. Asians (34%) speak only English in their homes. The remaining 66% speak a language other than English at home. The most common of these is Chinese, including Mandarin and Cantonese, spoken by 17% of Asians at home. Hindi (13%) is the second most commonly spoken non-English language among Asians, followed by Tagalog and other Filipino languages (9%) and Vietnamese (7%).
Nearly two-thirds of U.S.-born Asians (65%) speak only English at home. Most Asian immigrants, by contrast, speak a language other than English at home. Chinese is the most commonly spoken language among the foreign-born Asian population (22%), followed by Hindi (18%).
About a quarter of Asian Americans (27%) live in multigenerational households. That’s comparable to the share among all immigrants in the U.S. (28%), but higher than the share among Americas overall (19%). Asians who are immigrants are slightly more likely than U.S.-born Asians to reside in households with multiple generations under one roof (29% vs 23%).
Asians have a lower homeownership rate than the U.S. public overall (59% vs. 64%). Nevertheless, the homeownership rate is on the rise among Asian Americans, increasing from 53% in 2000 to 59% in 2019. Immigrant Asians were slightly more likely than U.S.-born Asians to be homeowners in 2019 (60% vs. 56%). Among the entire U.S. population, however, immigrants were less likely than the U.S. born to own a home in 2019 (53% vs. 66%).
On the whole, Asian Americans do well on measures of economic well-being compared with the overall U.S. population, but this varies widely among Asian origin groups. In 2019, the median annual household income of households headed by Asian people was $85,800, compared with $61,800 among all U.S. households. Foreign-born Asian households earned slightly more than those headed by U.S.-born Asians ($88,000 vs. $85,000).
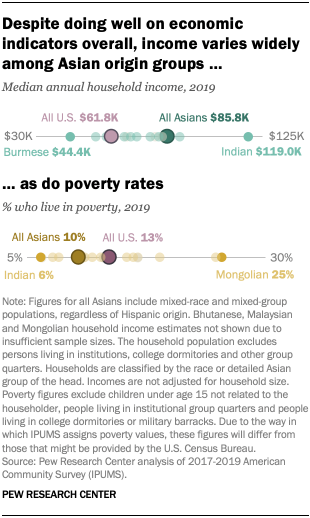
These overall figures hide differences among Asian origin groups, however. Households headed by Burmese Americans, for example, had significantly lower incomes than Asian Americans overall ($44,400 vs. $85,800). By contrast, only two Asian origin groups had higher household incomes than among Asian Americans overall: those headed by Indian Americans ($119,000) and those headed by Filipino Americans ($90,400).
All told, 12 Asian origin groups had higher median household incomes than the median among all Americans.
Asians are less likely than Americans overall to live in poverty (10% vs. 13% as of 2019). Poverty rates among U.S.-born and foreign-born Asians were 9% and 11%, respectively, that year. The poverty rate among immigrant Asian minors – those under the age of 18 – was slightly higher, at 16%.
Again, there are large differences in poverty rates among Asian subgroups. Most of the Asian origin groups analyzed (12 of 19) had poverty rates that were as high as or higher than the U.S. average in 2019. Mongolians (25%) had the highest poverty rates among Asian groups, while the lowest rate was among Indians (6%).
More than half of Asians ages 25 and older (54%) have a bachelor’s degree or more education, compared with 33% of the U.S. population in the same age range. Similar shares of U.S.-born (55%) and foreign-born Asians (54%) have earned a college degree. Both figures are substantially higher than the share of all U.S.-born people and all U.S. immigrants with a college degree (32% each).
Much like economic trends within the U.S. Asian population, there are wide disparities among origin groups. Indians ages 25 and older have the highest level of educational attainment among U.S. Asians, with 75% holding a bachelor’s degree or more in 2019. Bhutanese adults are the least likely Asian origin group to have a college degree (15%).
CORRECTION (Sept. 8, 2021): The figure originally reported for the 2019 Asian population is actually the number of responses of Asian groups to the American Community Survey question on race; individuals reporting more than one Asian group are counted multiple times. The Asian population, or the number of individuals choosing one or more Asian races, is 22.4 million in 2019. The findings in the report and chart “Asian population in U.S. nearly doubled between 2000 and 2019 and is projected to surpass 46 million by 2060” have been revised to reflect the population. The shares reporting specific Asian origin groups have been corrected to reflect the shares of the Asian population, rather than the shares of the Asian responses. No other findings in the report and fact sheets have been affected by these changes.
CORRECTION (Jan. 24, 2024): A previous version of this post misstated the share of Asian Americans ages 5 and older who speak Chinese at home. The text has been updated to reflect that 17% of U.S. Asians speak Chinese (including Cantonese and Mandarin) at home.
Note: This is an update of a post originally published Sept. 8, 2017. Read full methodology here.
