Updated May 25, 2017: This version of the report includes a note in methodology clarifying that the 1991 estimates for Germany are based on a sample of West German households only.
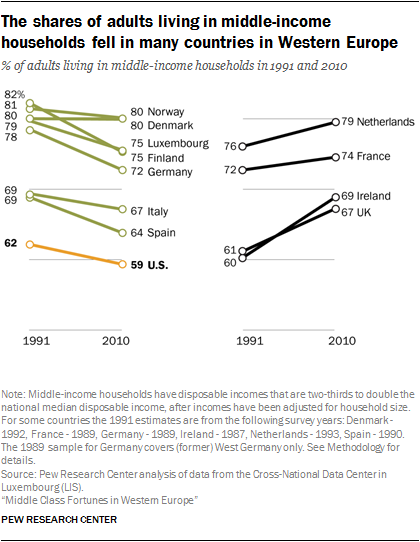
The fortunes of the middle classes in Western Europe’s largest economies are moving in opposite directions. From 1991 to 2010, the shares of adults living in middle-income households increased in France, the Netherlands and the United Kingdom, but shrank in Germany, Italy and Spain.1
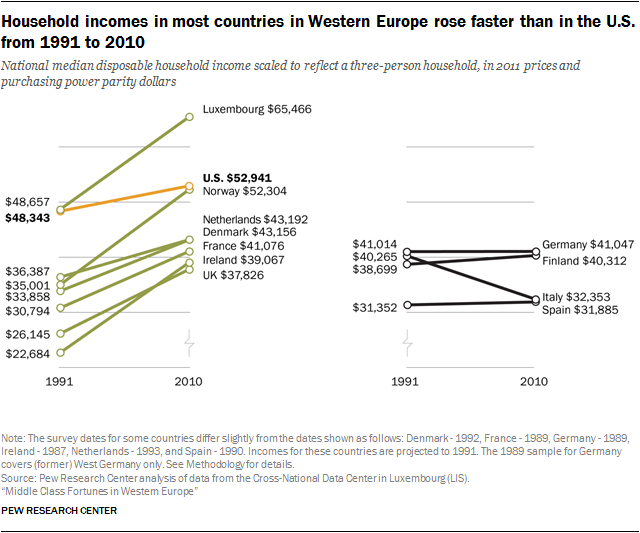
The divergent trajectories are linked to differences in how the incomes of households overall in these countries have evolved. France, the Netherlands and the UK experienced notable growth in disposable (after-tax) household income from 1991 to 2010. Meanwhile, incomes were either stagnant or falling in Germany, Italy and Spain.
Among the 11 Western European countries examined in this report, Ireland experienced the most rapid growth in income from 1991 to 2010 and the biggest expansion of the middle class. Several other countries in Western Europe also experienced large gains in household income. However, rising incomes did not translate into expanding middle classes in these countries. This group of countries includes Denmark, Luxembourg and Norway.
Overall, the middle-class share of the adult population fell in seven of the 11 Western European countries examined, mirroring the long-term shrinking of the middle class in the United States. In part, the shift out of the middle class is a sign of economic progress, irrespective of changes in household incomes overall. This is because the outward shift is accompanied by a move up the income ladder, into the upper-income tier, in all countries with a shrinking middle class.
At the same time, there is movement down the income ladder in most countries with a shrinking middle class. Overall, there is a greater movement up the income ladder than downward in most countries from 1991 to 2010, resulting in a general improvement in economic status.
But there is also a sharpening of economic divisions across households in many Western European countries and in the U.S. as relatively more adults are in the lower- and upper-income tiers and relatively fewer are in the middle.
Who is middle income?
In this report, “middle-income” adults have annual disposable household incomes from two-thirds to double the national median disposable household income, after incomes have been adjusted for household size (see Methodology). Disposable income – earnings from all sources, including government transfers, less income taxes and social security contributions – is the only comparable metric across countries in the LIS data for all years of interest. The income boundaries vary across countries, depending on a country’s own median disposable household income. Thus, the living standards of the middle class and of households in other income tiers also vary across countries. The income needed to be middle class also changes over time with changes in the national median household income.
The use of disposable household income as the metric for defining income tiers sets this report apart from previous analyses by Pew Research Center that use gross (pretax) household income as the metric. On the basis of gross income in 2010, 51% of American adults were estimated to live in middle-income households. But on the basis of disposable household income in 2010, 59% of Americans were middle income. The share of adults who are middle income is estimated to be higher if disposable income is used because the progressive design of income taxes reduces the disparity in incomes across households. Appendix C presents estimates based on both disposable and gross incomes for a selected number of countries.
These are among the key findings from a new comparative, cross-national analysis by Pew Research Center, using data from the Cross-National Data Center in Luxembourg (LIS), a research center that harmonizes and provides access to data from government surveys and other sources. The study covers the period 1991-2010 for the following countries: Denmark, Finland, France, Germany, Ireland, Italy, Luxembourg, the Netherlands, Norway, Spain, the UK and the U.S.2 Estimates for 2013 for eight of these countries are presented in Appendix A.3
In this report, “middle-class” adults live in households with disposable incomes ranging from two-thirds to double the national median disposable household income.4 Disposable income includes earnings from work, interest and dividend income, rental income, and transfer income such as government assistance and family transfers, but subtracts income taxes and social security contributions. It is the only measure of income comparable across all countries in the source data.5
Estimates of income in this report are adjusted for household size and expressed in 2011 prices and purchasing power parities.6 This allows for comparisons across households of different sizes while adjusting for cost-of-living differences over time and across countries. Also, incomes are scaled to reflect a household size of three for reporting purposes.7 The average size of a household in the U.S. is 2.5 and is between two and three in the countries in Western Europe. (See the text box “Who is middle income?” and Methodology for details.)
By world standards, the countries featured in this report are all high income. The demarcation of their lower-, middle- and upper-income tiers is based on the relative well-being of households within these countries. Middle-income households in Western Europe and in the U.S. are in the highest income tiers globally, and most lower-income households in these countries would be in the global middle class.
Some of the report’s findings may reflect the impact of the Great Recession of 2007-2009 that was felt across the U.S. and Western Europe, perhaps most deeply in Ireland, Italy and Spain. More specifically, it is likely that income levels in 2010 were below what they might have been absent the recession in most countries.
Middle income or middle class?
The terms “middle income” and “middle class” are often used interchangeably. This is especially true among economists, who typically define the middle class in terms of income or consumption. But being middle class can connote more than income, be it a college education, white-collar work, economic security, homeownership, or having certain social and political values. Class could also be a state of mind, that is, it could be a matter of self-identification (Pew Research Center, 2008, 2012). The interplay among these many factors is examined in studies by Hout (2007) and Savage et al. (2013), among others.
This report uses household income to group people. For that reason, the term “middle income” is used more often than not. However, “middle class” is also used at times for the sake of exposition. Gornick and Jäntti includes several studies that use an income-based approach to study a variety of issues related to the middle classes in a number of countries.
Estimates of the shares of people who were middle class in 2010 could also be affected by the Great Recession. But the impact is muted by the fact that the income needed to be included in the middle class changes over time, rising as national income increases and falling as it decreases (see the text box “Who is middle income?”). As the income boundaries adjust to changes in the overall economic environment, the movement of people in or out of the middle is dampened.
Despite increased integration and widespread growth, Western Europe’s economic trajectory is far from unified
The post-1990 period in Europe is marked by several significant economic and political events. The German reunification in 1990 was followed by the Maastricht Treaty on European Union in 1993.8 The Schengen Agreement took effect in 1995, allowing for passport-free travel across much of Europe, and the euro entered circulation in 2002, tightening economic bonds across Europe.
But Western European economies did not fare similarly with the emergence of a single European market. Economies to the south, such as those of Italy and Spain, did not prosper like northern ones such as Norway and the Netherlands. Ireland, for example, was dubbed the Celtic Tiger due to the rapid expansion of its economy since 1990. The British economy also expanded due to reforms instituted in the 1980s, according to analysts.
Germany, the largest economy in Western Europe and a global powerhouse, struggled from 1991 to 2010. The growth in Germany’s per capita gross domestic product in the 1990s was the lowest among the countries examined in this report9 Analysts point to the role of German reunification as a factor behind the lackluster economic performance in the 1990s. Although Germany fared better than several other Western economies from 2000 to 2010, it too felt the impact of the Great Recession and overall growth remained slow.
Lingering differences across European Union countries remain in income and productivity levels, labor market outcomes and the overall competitiveness of some economies.10 Among the countries included in this study, Italy and Spain lag behind the others on most of these counts.
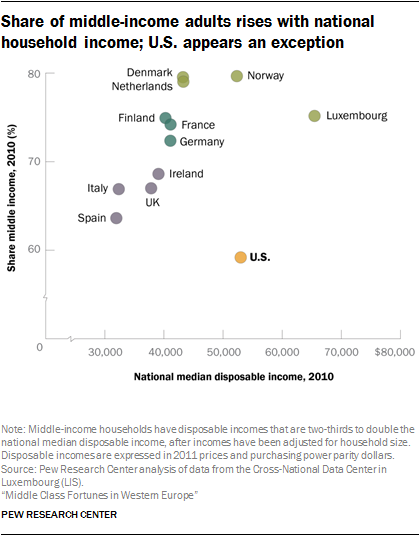
The selected countries in Western Europe also fall into three broad groups based on their overall income and the shares of adults who are middle class. One group is comprised of Spain, Italy, the UK and Ireland. The national median disposable income in these four countries ranged from $30,000 to $39,000 in 2010 and the middle-class shares ranged from 64% to 69%, the lowest incomes and the smallest middle classes among the Western European countries examined.
The second group of countries includes Germany, France and Finland, with national median disposable incomes of about $40,000 to $41,000 and middle-class shares ranging from 72% to 75%. The third group consists of Luxembourg, the Netherlands, Denmark and Norway. The median income in these countries ranged from $43,000 to $65,000 and the middle-class shares extended from 75% to 80% in 2010.
The U.S. represents a significant exception to this general relationship between national income and the middle-income share. The median income in the U.S. – $53,000 – exceeded the median income in all countries but Luxembourg in 2010. As noted, however, the share middle class in the U.S. (59%) is less than in any of the selected countries from Western Europe.
The American experience reflects a marked difference in how income is distributed in the U.S. compared with many countries in Western Europe. More specifically, the U.S. has a relatively large upper-income tier, placed well apart from an also relatively large lower-income tier. This manifests not only as a smaller middle-income share but also as a higher level of income inequality. The gap between the earnings of households near the top of the income distribution and the earnings of those near the bottom is the widest in the U.S.
Compared with Western Europe, the U.S. middle class is smaller, but its income is greater
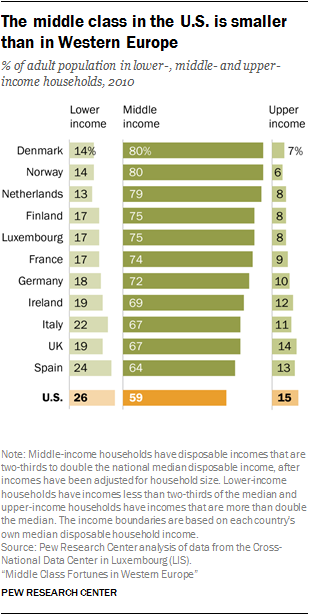
In 2010, households in the U.S. were more economically divided than households in the Western European countries examined in this report. The U.S. is the only country in which fewer than six-in-ten adults were in the middle class. Meanwhile, compared with those in many Western European countries, greater shares of Americans were either lower income (26%) or upper income (15%).
The middle class is a significant presence in the Western European countries analyzed, even as it is shrinking in many countries. Middle-class shares ranged from 64% in Spain to 80% in Denmark and Norway in 2010. The share of adults who were lower income was lowest in the Netherlands (13%) and highest in Spain (24%), and upper-income shares ranged from 6% in Norway to 14% in the UK.
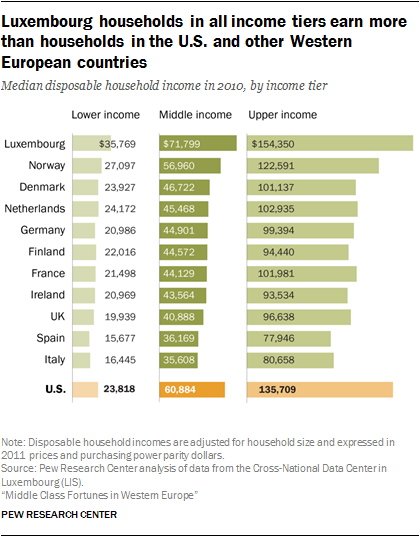
Financially, the American middle class is ahead of the middle classes in the Western European nations in terms of disposable household income, with the exception of Luxembourg.11 Middle-income households in Luxembourg lived on $71,799 annually in 2010, at the median, followed by $60,884 in the U.S. The middle class in Italy lived on a median income of $35,608, the most modest means among the 12 countries.
Likewise, the earnings of upper-income Americans ($135,709 in 2010) trailed only their counterparts in Luxembourg ($154,350). Upper-income households in Spain had a median income of $77,946, the lowest in this group. By contrast, lower-income Americans are middle of the pack in terms of earnings, lagging behind or barely matching lower-income adults in Luxembourg, Norway, the Netherlands and Denmark.
What it takes to be middle class varies across countries
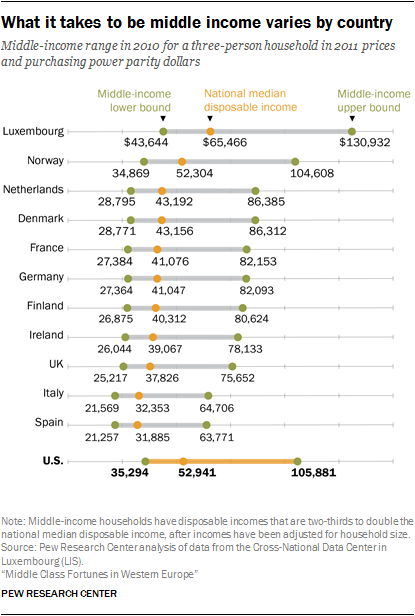
The income it takes to be middle income varies across countries because the boundaries are based on each country’s median disposable income.12 In 2010, the median disposable income was as low as $31,885 in Spain, but as high as $65,466 in Luxembourg (with incomes expressed in 2011 prices and purchasing power parities and standardized to a household size of three). This meant that a household in Spain was middle income in 2010 if its disposable income was in the range of $21,257 to $63,771, while middle-income households in Luxembourg lived on $43,644 to $130,932.
In the U.S., with a national median disposable household income of $52,941 in 2010, the middle-income range was $35,294 to $105,881 for a household of three.13 This standard of living was about matched by middle-income households in Norway. But middle-income households in the Netherlands, Denmark, France, Germany, Finland, Ireland and the UK lagged behind, as did the middle-income tier in Italy, which mirrors that in Spain.14
The role of the middle class in developed economies
The size and the well-being of the middle class are intertwined with some of the key economic challenges facing the developed world this century – income inequality is rising in many countries, economic growth is anemic, and economic mobility is lesser than in the past.
A smaller middle class or a relatively less well-off middle class often reflects a more unequal income distribution. In turn, increases in income inequality present an adverse climate for economic growth. A relative decline in the incomes of lower- and middle-income families may create a drag on overall consumption in the economy, lead to excessive borrowing by these families, or provide disincentives to invest in education.
A more vibrant middle class may also improve the economic outlook for future generations. In the U.S., for example, communities with larger middle classes offer a greater likelihood that children will experience upward mobility relative to their parents’ status in the income distribution. A similar relationship has also been found to exist across countries, whereby intergenerational mobility is greater in countries with less income inequality.
The economic concerns of the middle class, or more generally of those not in the upper-income tier, may also contribute to changes in the social and political trajectories of a country. For example, the increase in income inequality in America may be linked to a rise in political polarization. More recently, the votes the Republican Party gained in America’s middle-class communities and among working-class voters were key factors in the election of Donald Trump in 2016. This has renewed interest in how the ongoing economic slowdown, automation and globalization have impacted the middle classes.
Road map to the report
This report examines the state of the middle classes in the U.S. and 11 countries in Western Europe and how their economic well-being has changed since 1991. In drawing comparisons over time, households that were in the lower-, middle- or upper-income tier in, say, 2010 are compared with households in those tiers in 1991 or other years. The analysis does not follow the same households over time, and some households that were middle income in 1991 may have moved to a different tier in 2010 or 2013. The demographic composition of each income tier may also have changed over the period.
The report is organized as follows: Chapter 1 presents estimates of the sizes of lower-, middle- and upper-income tiers in the U.S. and selected countries from Western Europe. It also shows how the income tiers changed since 1991. Chapter 2 focuses on the incomes of each tier and how they have changed over time, and Chapter 3 covers the distribution of aggregate household incomes across income tiers in each country.
The Methodology section discusses the source data in more detail and describes how incomes are adjusted for household size and projected over time.15 A series of appendices present supplementary data through 2013; a closer look at how the middle-income boundaries vary by household size in each country and may change over time; the share of the adult population in lower-, middle- and upper-income tiers in each country using gross household income as the metric to define middle-income boundaries; the population shares of each income tier using the median household disposable income in the U.S. as the standard for all countries; a more detailed look at the income distributions in all countries; and charts showing changes over time in the relative sizes of each income tier and the median income of each tier in all countries.
“Middle-income” households are defined as those with an income that is two-thirds to double that of their country’s median disposable household income, after incomes have been adjusted for household size. Lower-income households have incomes lower than two-thirds of the median, and upper-income households have incomes that are more than double the median. The income boundaries vary across countries, depending on each country’s own median household income.
The terms “middle income” and “middle class” are used interchangeably in the report.
Disposable income is the sum of earnings from work, capital income such as interest and dividends, rental income, and transfer income such as government assistance and family transfers, less income taxes and social security contributions.
Income estimates are adjusted for household size, scaled to reflect a household size of three, and reported in 2011 prices and purchasing power parities. Purchasing power parities are exchange rates adjusted for differences in the prices of goods and services across countries.
For some of the countries examined, the 1991 estimates are derived from the following survey years: Denmark – 1992, France – 1989, Germany – 1989, Ireland – 1987, Netherlands – 1993, Spain – 1990. The 1991 estimates for Germany are based on a sample of (former) West German households only. Estimates for Finland, Italy, Luxembourg, Norway, the United Kingdom and the United States are based on 1991 survey data. The year “1991” is used to refer to the estimates for all countries for the sake of convenience.
For most countries in most years, adults are placed into income tiers based on their household income in the calendar year previous to the year the survey was conducted. Thus, while the income data in the report refer to 1991, 2000, 2010 and 2013, the distributions of adults by income tier are often derived from population counts in 1992, 2001, 2011 and 2014.
The analysis does not follow the same households over time, and some households that were middle income in 1991 may have moved to a different tier in 2010 or 2013. The demographic composition of each income tier may also have changed over the period.
Differences between numbers or percentages are computed before the underlying estimates are rounded.


