One way to further understand how well the surveys performed is to compare survey respondents with those who did not respond to the survey, using household data from third-party sources. An attempt was made to match all responding and non-responding households to records in two large national databases so they could be compared on a variety of characteristics available in the databases. These databases are provided by commercial vendors and include information on nearly every U.S. household, drawn from both public and private sources.
The utility of the two national databases for judging the representativeness of the survey sample depends on the share of the survey sample for which database information is available and on the accuracy of the information in the databases. About half (49%) of households in the landline sample could be matched to the voter database and 64% of could be matched to the consumer database. Matching the cell phone sample was not possible for most numbers, other than some of the responding households where a name or address was obtained. And for many households in our sample, there were multiple matches to records in the database and decisions had to be made about which records to select.
To assess the accuracy of the databases, household information in the databases was compared with answers given by survey respondents on a variety of characteristics. In general, the analysis finds that the information in the databases compares reasonably well to data provided by respondents in the survey. For additional information about validating the databases, see the Appendix.
Overall, the financial characteristics and technology and media use of survey respondents and non-respondents are quite similar, but there are some differences when it comes to lifestyle and interests. Using characteristics about the households from the consumer database, responding households in the landline sample were compared with households who refused to participate and households where a person was never reached.

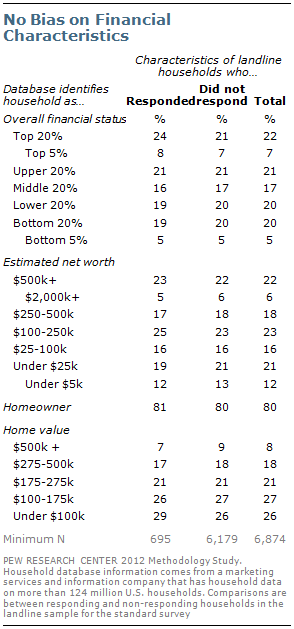
The financial profile of responding households closely matches that of households that did not take part in the survey. The estimated net worth of responding and non-responding households is quite similar; households whose net worth is under $100,000 make up 35% of responding households and 37% of non-responding households. Similarly, the overall financial status of responding and non-responding households is quite similar.
Responding households are no more likely to be homeowners than those that did not participate (81% vs. 80%). Similarly, there are virtually no differences between responding and non-responding households in terms of the value of their home; 7% of responding and 9% of non-responding households have home values of $500,000 or more. Similarly, 29% of responding households have home values less than $100,000, compared with 26% of households that did not participate.
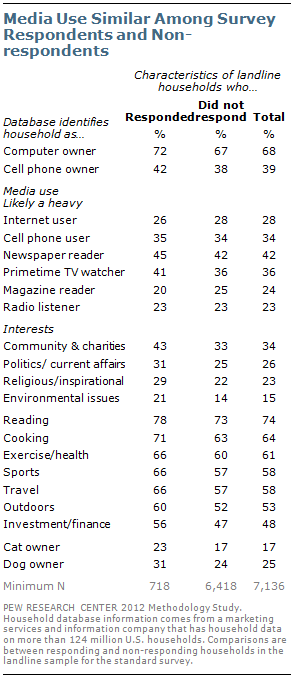
Responding households also are quite similar to non-responding households when it comes to technology and media use. Slightly more responding households own a computer than households who did not participate (72% vs. 67%), but a similar share own a cell phone (42% vs. 38%). When it comes to media use, responding households are no more likely than those that refused to participate to be heavy internet users, newspaper or magazine readers, primetime TV watchers, or radio listeners.

There are some small but significant differences between responding and non-responding households on various lifestyle and interest measures. More non-responding households than responding households were not flagged on any of the interest measures (15% vs. 8%). This suggests that differences between responding and non-responding households on these interest measures may be, at least partly, due to differences in the availability of data.
A larger proportion of responding than refusing households are interested in community affairs and charity (43% vs. 33%) and politics and current affairs (31% vs. 25%). There are similar differences on interest in religious and inspirational topics and environmental issues.
There also are some differences between responding and non-responding households on interest in reading (78% vs. 73%) and exercise and health (66% vs. 60%). According to information available in the database, there also are differences on interest in cooking, sports, travel and interest in investment and finance. In addition, a slightly larger share of responding than non-responding households have a pet.
Additional analysis separated non-responding households into two groups – known households who refused to take part in the survey and households in which no contact was made – that could be compared with survey respondents. In general, the differences between responding households and refusing households are similar to the comparisons shown above and in some cases the differences are smaller. See the Appendix for tables with these comparisons.


