Introduction
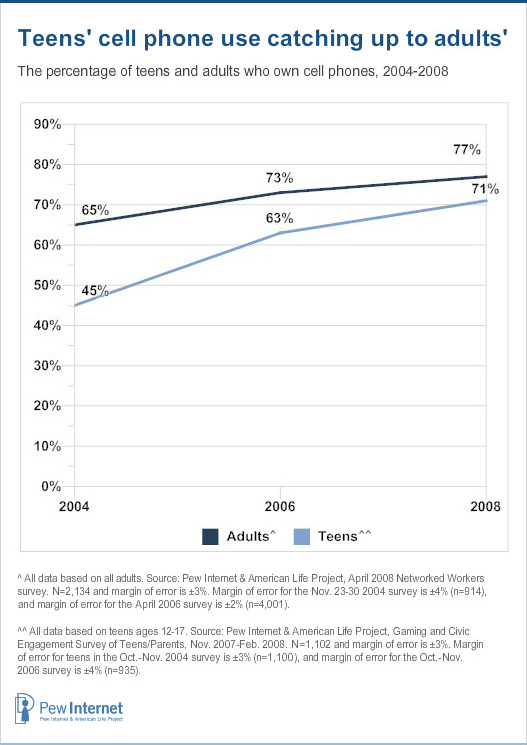
Teenagers have previously lagged behind adults in their ownership of cell phones, but several years of survey data collected by the Pew Internet & American Life Project show that those ages 12-17 are closing the gap in cell phone ownership. The Project first began surveying teenagers about their mobile phones in its 2004 Teens and Parents project when a survey showed that 45% of teens had a cell phone. Since that time, mobile phone use has climbed steadily among teens ages 12 to 17 – to 63% in fall of 2006 and then to 71% in early 2008.
In comparison, 77% of all adults (and 88% of parents) had a cell phone or other mobile device at a similar point in 2008. Cell phone ownership among adults has since risen to 85%, based on the results of our most recent tracking survey of adults conducted in April 2009. The Project is currently conducting a survey of teens and their parents and will be releasing the new figures in early 2010.
We went back to our databanks in light of the intriguing findings about adult mobile phone use in two of our recent reports,1 and to help lay the ground work for our current project on youth and mobile phones. Among our questions: How does teen cell phone use stack up against their adoption of other technologies? Our surveys show that while 71% of teens owned cell phones in 2008:
- 77% of teens own a game console like an Xbox or a PlayStation
- 74% of teens own an iPod or mp3 player
- 60% of teens “own” a desktop or laptop computer
- 55% of teens own a portable gaming device.
The computer ownership number has been stable since 2006, but it is somewhat complicated because it is sometimes hard for teens and their parents to sort out who owns what technology in a household. Cell phones and mp3 players are personal and heavily personalized devices and tend to be “owned” by one individual. Game-related devices are more likely to be conceived of by families as “owned” by the children in the household, while computers are more likely to be owned collectively by the family, or by the adults in the household.
Who has a mobile phone?
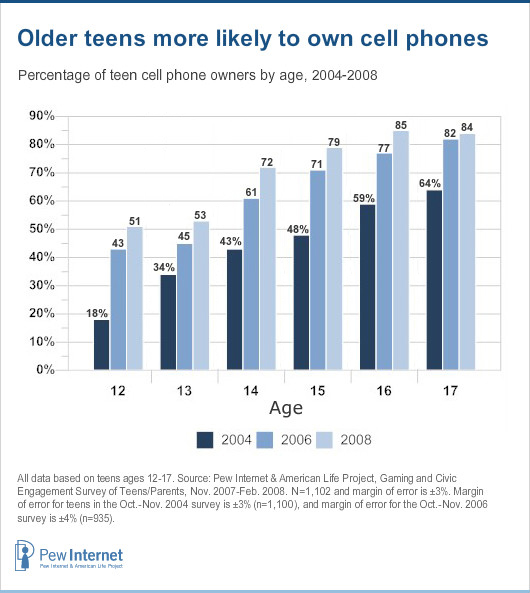
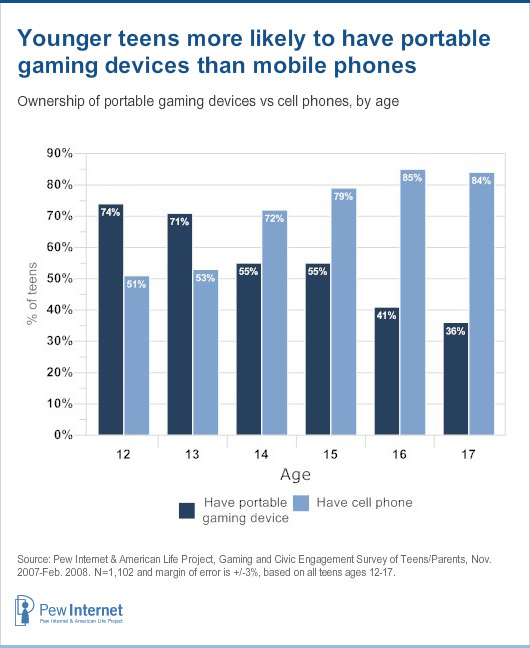
Among teens, age is the most important variable in mobile phone ownership. Older teens are much more likely to own phones than younger teens, and the largest increase occurs at age 14, right at the transition between middle and high school. Among 12-13 year olds, 52% had a cell phone in 2008. Mobile phone ownership jumped to 72% at age 14 in that survey, and by the age of 17 more than eight in ten teens (84%) had their own cell phone.
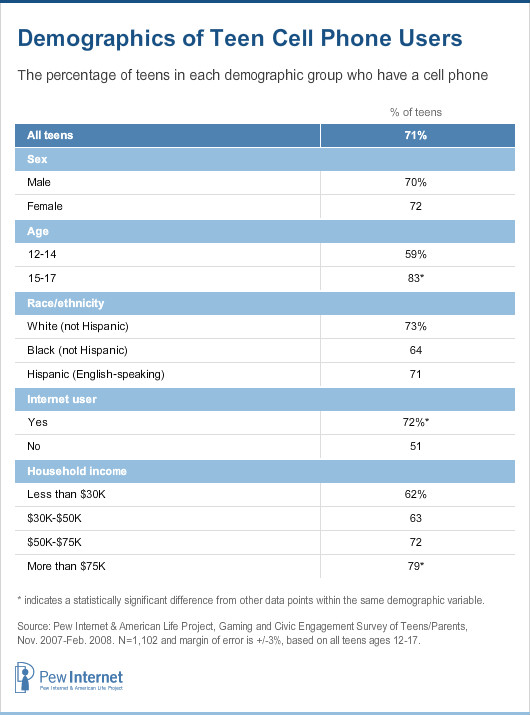
Beyond age, there are few differences in mobile phone ownership by other personal characteristics. Girls and boys are equally likely to own a phone and there are no differences by race or ethnicity in phone ownership. However, there are small differences in phone ownership by socio-economic status; in families with the highest levels of income and education, teens are more likely than in less well-off families to have a cell phone.
Internet users are more likely than non-users to have a cell phone; however half of teens who do not go online do own a mobile phone.
How are teens using phones, mobile or otherwise?
For teens as a whole, landline phones remain the most widespread method of communication with friends. Fully 88% of all teens – regardless of whether or not they own a cell phone – say that they talk to their friends on a landline phone at least occasionally. By comparison, 67% of all teens say they talk to friends on a cell phone, and 58% of all teens say they have ever sent a text message.4
When we look specifically at teen cell phone owners (71% of the teen population in the 2008 survey), 94% of them have used their mobile phones to call friends and 76% have sent text messages. Still, landlines have not lost their relevance for teens with cell phones; 87% of teenage cell phone users still talk to their friends on landlines.
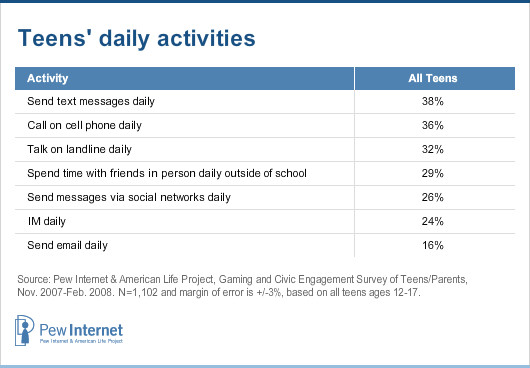
Perhaps more illuminating with regard to what teens really enjoy are the Project’s findings on daily telephone related activities, and how these stack up against other types of communication. For daily activities, cell phone-based communication is dominant, with nearly 2 in 5 teens sending text messages every day. Voice calling on cell phones is nearly as prevalent, as more than a third (36%) of all teens (and 51% of those with cell phones) talk to their friends on the cell phone every day.
Landline phones5 are also important in teens’ daily lives, with 32% of teens saying they use them to make calls on a daily basis. A considerable number of teens with cell phones continue to use landlines daily and at the same rate as their cell phone-less counterparts, with 33% of cell owners making a call on a landline each day. Teens still speak and interact in person, too. About one in three teens (29%) spend time with friends in person outside of school on a daily basis.
The three other primarily text-based forms of communication stand at the bottom of the list of daily communication activities. A bit more than a quarter (26%) of all teens send messages (emails, instant messages, group messages) through social networking sites – and 43% of teens who use social networks send messages daily. Similarly, another 26% of teens send and receive instant messages on a daily basis and 16% send email every day.
How teens use voice calling
Girls ages 12-17 are more likely than boys to use any kind of phone for voice calling. More than a third (36%) of girls say that they use a landline phone daily, compared with 27% of boys. Similarly, 55% of girls with cell phones talk daily on their cell phone, while 47% of cell phone-owning boys report the same.
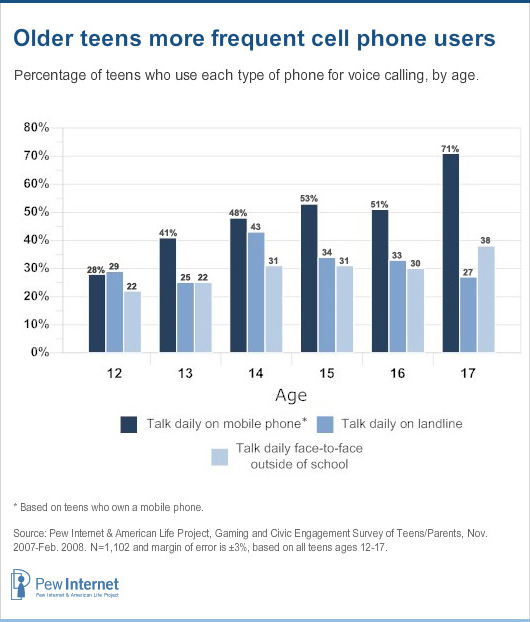
The older the teen, the more likely she uses her phone frequently. Older teens use them to talk to friends on a daily basis; younger teens tend to use mobile phones to call pals a few times or less per week. More than seven in ten 17-year-olds with phones talk to friends on their cell phones daily, while just 28% of 12-year-olds with phones say the same. A large percentage of phone-owning younger teens ages 12-14 say that they talk to friends at least once a week – 18% of those ages 12-14 report weekly cell phone use, while 10% of those ages 15-17 do.
Landline phones do not show these differences in frequency of use by age – older and younger teens are just about as likely to talk every day. If anything, landline phone use shows a slight increase during the mid-teen years (ages 14-16) and then drops off again as teens near the end of high school. Face to face conversations outside of school rise modestly with age, from 22% of 12 year olds having them daily to 38% of 17 year-olds reporting daily face-to-face interactions outside of school. Nevertheless, this increase by age pales in comparison to the growth in daily mobile phone conversations from age 12-17 among cell phone users.
How teens use text messaging
Use of text messaging by teens has increased since 2006, both in overall likelihood of use and in frequency of use. In 2006, 51% of all teens, regardless of cell phone ownership, had ever sent a text message, while 58% had done so by 2008. Similarly, daily use of text messaging is also up, from 27% of teens using text messaging daily in 2006 to 38% texting daily in 2008.6
Text messages aren’t just sent via phones – texts may be sent on desktops or laptops as well, generally through email clients. And as teens migrate away from standalone email to messaging through social networks, these online networks are often vehicles for the sending of text-based short messages by teens. Among social network users, 54% of teens on those sites send IMs or text messages to friends through the social networking system.7
Girls are more likely than boys to send and receive text messages frequently, as are older teens ages 15-17. More than 2 in 5 girls (42%) send text messages to friends daily, while about a third (34%) of boys do the same. The difference between younger and older teens is even starker – 25% of teens ages 12-14 send text messages daily compared 51% of teens ages 15-17. As with phone ownership and other uses of mobile devices, there are no racial or ethnic differences when it comes to text messaging. However, teens from wealthier households are slightly more likely to text message frequently compared with teens from lower income households; 42% of teens from households earning more than $50,000 annually send texts daily, compared with 33% of teens from homes earning less than $50,000 per year.
Other mobile devices – portable gaming devices
Even though the focus of this piece has been on mobile phones, teens have access to other mobile devices that connect them to other people and other networks. The most prevalent of these devices are mobile gaming devices like the Nintendo DS and DSi and the Sony PlayStation Portable (PSP).
Mobile gaming devices are owned predominantly by younger teens (those ages 12-14). Two-thirds (67%) of 12-14 year olds own a portable gaming device, compared with 44% of teens ages 15 to 17. The most notable drop occurs at age 14, typically a time of transition between middle and high school for many teens.
These mobile gaming devices are also more likely to be owned by boys, with 61% of boys owning one of these devices compared with just under half (49%) of all girls. There are no differences in ownership by race or ethnicity or by family income or education – all groups are equally likely to have portable gaming devices.
But what can teens do on these devices, beyond local game play? The PSP offers internet connectivity (generally through WiFi) and now has a version of Skype, a free voice over IP (VoIP) application that allows users to make calls, often for free, over the internet. Skype also has an embedded instant messaging client, meaning that PSP users can IM others from their device.
The DS(i) is somewhat more limited, but has a local area wireless network tool that allows users to interact with others also on a DS(i) within 30-100 feet of them, via a visual chatting interface called pictochat. The DS(i) also allows gaming over the local network as well as WiFi-based internet gaming.
Methodology
Four different teen data sets were used to produce this report. Unless otherwise specified, the data in this report comes from the Teens, Gaming and Civics survey, fielded between November 2007 and February 2008. Methodological details for each survey appear below.
The Parent and Teen Survey on Gaming and Civic Engagement, sponsored by the Pew Internet and American Life Project and supported by the John D. and Catherine T. MacArthur Foundation, obtained telephone interviews with a nationally representative sample of 1102 12- to 17-year-olds and their parents in continental U.S. telephone households. The survey was conducted by Princeton Survey Research International. Interviews were done in English by Princeton Data Source, LLC, from November 1, 2007, to February 5, 2008. Statistical results are weighted to correct known demographic discrepancies. The margin of sampling error for the complete set of weighted data is ±3.2%.
The Parent & Teen Survey on Writing, sponsored by the Pew Internet and American Life Project and supported by the College Board’s National Commission on Writing, obtained telephone interviews with a nationally representative sample of 700 12 to 17 year olds and their parents in continental U.S. telephone households. The survey was conducted by Princeton Survey Research Associates International. The interviews were done in English by Princeton Data Source, LLC from September 19 to November 16, 2007. Statistical results are weighted to correct known demographic discrepancies. The margin of sampling error for the complete set of weighted data is ±4.7%.
The Parents & Teens 2006 Survey, sponsored by the Pew Internet and American Life Project, obtained telephone interviews with a nationally representative sample of 935 teens age 12 to 17 years-old and their parents living in continental United States telephone households. The survey was conducted by Princeton Survey Research Associates International. The interviews were done in English by Princeton Data Source, LLC from October 23 to November 19, 2006. Statistical results are weighted to correct known demographic discrepancies. The margin of sampling error for the complete set of weighted data is ±3.7%.
The Parents & Teens 2004 Survey sponsored by the Pew Internet and American Life Project obtained telephone interviews with a nationally representative sample of 1,100 teens 12 to 17 years-old and their parents living in continental United States telephone households. The interviews were conducted in English by Princeton Data Source, LLC from October 26 to November 28, 2004. Statistical results are weighted to correct known demographic discrepancies. The margin of sampling error for the complete set of weighted data is ±3.3%.
The adult data in this report was drawn from four separate data sets – April 2009, April 2008, November 2006 and November 2004. All data was collected by Princeton Data Source, LLC and all surveys were conducted in English. Surveys did not contain cell phone-based interviews except where noted. The April 2009 Survey was fielded from March 26- April 19th 2009, and interviewed 2,253 American adults, including 561 respondents reached on a cellular telephone. Margin of error for results based on the total survey are plus or minus 2 percentage points. The April 2008 survey was fielded from March 27th to April 14th, 2008 and interviewed 2,134 American adults. The margin of error for results based on the total survey are plus or minus 3 percentage points. The April 2006 survey was fielded from February 15th to April 6th, 2006 and interviewed 4,001 subjects with a margin of error of plus or minus 2 percentage points. And the November 2004 survey was fielded from November 23rd through November 30th, 2004. It surveyed a total of 914 respondents and had a margin of error of plus or minus 4 percentage points.
About the Pew Research Center’s Internet & American Life Project
The Pew Internet Project is an initiative of the Pew Research Center, a nonprofit “fact tank” that provides information on the issues, attitudes and trends shaping America and the world. The Pew Internet Project explores the impact of the internet on children, families, communities, the work place, schools, health care and civic/political life. The Project is nonpartisan and takes no position on policy issues. Support for the project is provided by The Pew Charitable Trusts.


