In response to popular demand, my Pew Research colleagues and I posted detailed demographic tables for the “Tracking for Health” study.
I should warn you: These are not pretty tables. You may need a ruler to keep track of the rows and columns since we crammed as much data into each table as possible. But I think they will be useful and that, to me, is a high compliment (right after “thoughtful” — that’s the best).
For example, I think it’s intriguing to look at some of the patterns. If you click through and scroll to the fifth table: Women are more likely than men to track health data on paper (40% vs. 28%). You can tell that is a statistically significant difference because there is a tiny “a” next to the 40.
Another interesting finding: Young adults are significantly more likely than older adults to have an app to help them track their health (16% of 18-29 year-old trackers, compared with 3% of 50-64 year-old trackers). Notice there are no statistically significant differences (and therefore no superscript letters) in the race and ethnicity findings.
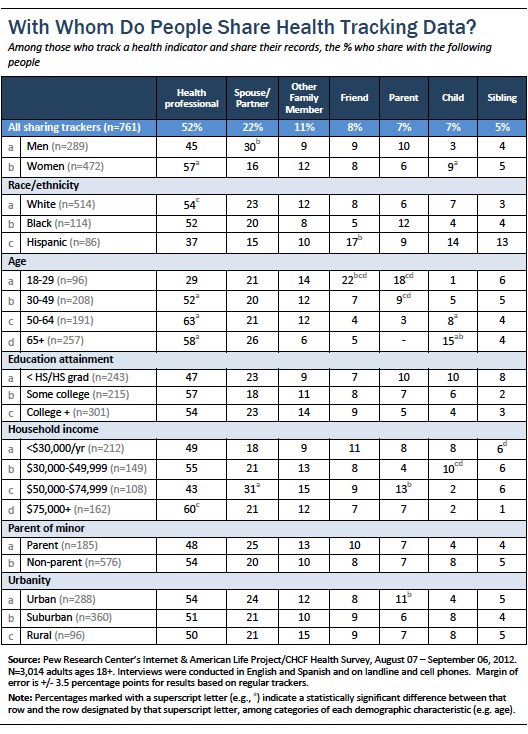
Here’s the last table in the appendix:

My colleague Maeve Duggan pointed out that men are more likely than women to share their data with their spouse or partner (30% vs. 16%). We wondered if it is because women are less likely to share their current weight?
Please dig in and let us know what you think! Comments are open on my blog.


