A more in-depth look at the findings across this study that relate to social media reveals that, overall, social media plays a moderate role in local news – sometimes eclipsing traditional pathways in popularity but still being decidedly less prominent than the television. It is more commonly preferred by Americans living in some types of local areas, such as those with younger residents and a higher proportion of Hispanic and black residents. In addition, those who prefer social media as a pathway to local news tend to follow local news less closely.
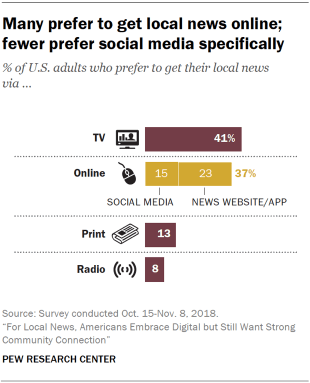
Among U.S. adults, 15% say social media is their preferred pathway to local news, a bit lower than the 23% who cite websites or apps and far behind the 41% who cite the television set. However, the share who prefer social media is roughly equal to the 13% who prefer print newspapers, and higher than the 8% who prefer radio. (As noted in Chapter 1, social media and websites combined put online pathways nearly on par with the TV.)
Roughly one-in-four U.S. adults often get local news from either social media (25%) or websites and apps (26%); 72% and 81%, respectively, ever get news through these digital means.
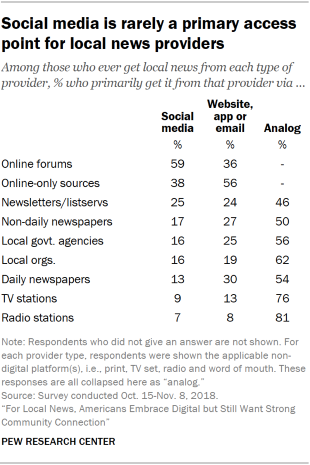
Americans’ use of social media for local news seems to be fairly broad at this point; few say it is the main way they access specific local news providers. Among the nine types of providers asked about here, social media stands out as a primary access point for only one: online forums or discussion groups such as community Facebook groups or Nextdoor. More than half who get local news from these groups (59%) mainly access them through social media (vs. 36% who mainly access them through websites or email). No more than four-in-ten who use the other providers primarily access them on social media. For example, 13% who get local news from daily newspapers primarily access them via social media, compared with three-in-ten who primarily use websites, apps or email and 54% who primarily use print newspapers.
This lower prominence also comes through in a separate question about how important social media is as a way of getting local news. Only 14% of U.S. adults name it as most important, four-in-ten say is it somewhat important and about two-in-ten (17%) say it is not an important way at all.
Finally, the public sees social media as a moderately important part of news organizations’ digital offerings. Fewer online news consumers say regularly updated social media accounts are important to their online news experience (51%) than say that of an easy-to-use website (82%) or a schedule of local events (59%). But regularly updated social media accounts do score higher on this measure than videos (43%) or the ability to comment on news stories (31%). Separately, just 21% of U.S. adults say it is very important for journalists to be active on social media, while nearly four-in-ten (37%) say it is not very or not at all important.
Certain types of Americans – and those in certain types of American communities – rely more on social media for local news
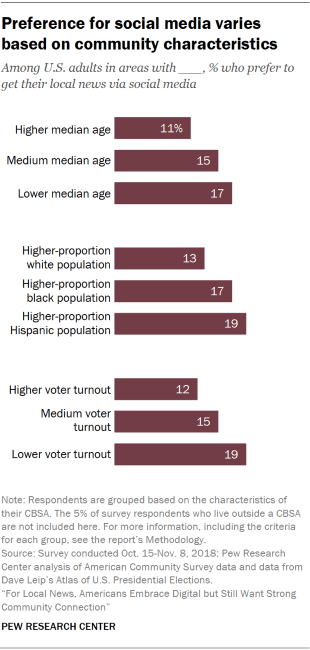
- Those with a younger population (17% prefer social media, vs. 11% in areas with a higher median age);
- Those with a higher proportion of Hispanics (19%) compared with those with a higher proportion of whites (13%);6
- Those with lower voter turnout (19% vs. 12% in areas with higher voter turnout in 2016).
Americans’ personal demographics influence their preference for social media in similar ways. Social media is more likely to be the preferred pathway to local news among:
- Those ages 18 to 29 (32% prefer social media, vs. 17% of those ages 30 to 49, 7% of those 50 to 64 and 3% of those 65 and older);
- Hispanics (22% vs. 12% of white non-Hispanics and 15% of black non-Hispanics);
- Those who prefer mobile devices for getting news online (21% vs. 9% who prefer desktop/laptop computers and 14% who prefer both equally);
- Those who are not registered to vote (22% vs. 11% who are registered).
In addition, social media is preferred at nearly twice the rate among those who do not pay for local news (16%) as those who do (9%) – giving further evidence to the finding that those who do not pay for local news primarily do so because there are many free options available.
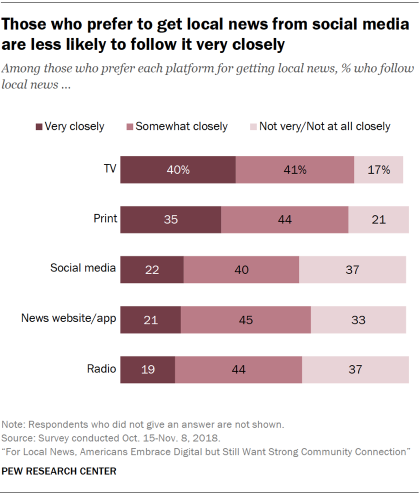
As a group, Americans who prefer social media stand out in some ways. They have lower interest in local news overall. Only about one-in-five of those who prefer social media (22%) also say they follow local news very closely; 40% follow local news somewhat closely, and 37% follow local news not very or not at all closely. This is a much lower rate than those who prefer print (35% follow local news very closely) or the television (40%), but it is about on par with those who prefer websites/apps or the radio.
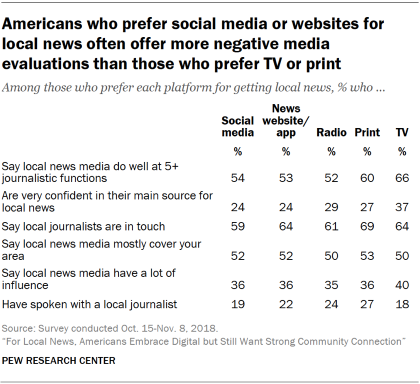
Finally, Americans who prefer social media are often more negative about the local news media than those who prefer TV or print, but they do not consistently stand apart from those who prefer websites or radio. Looking specifically at social media versus the TV set as a pathway to local news, Americans who prefer social media are less likely to see their local news media doing well at multiple job roles or being in touch, and they are less confident that their main source of local news can get them the information they need. But on questions of local media being influential or covering their local area, these groups do not differ.

