In a fragmented media environment with seemingly endless sources of information to choose from, Americans’ news habits have changed dramatically in the 21st century. Today, an overwhelming majority of Americans get news at least sometimes from digital devices. This fact sheet looks at the platforms Americans turn to for news, including patterns and trends.

News consumption across platforms
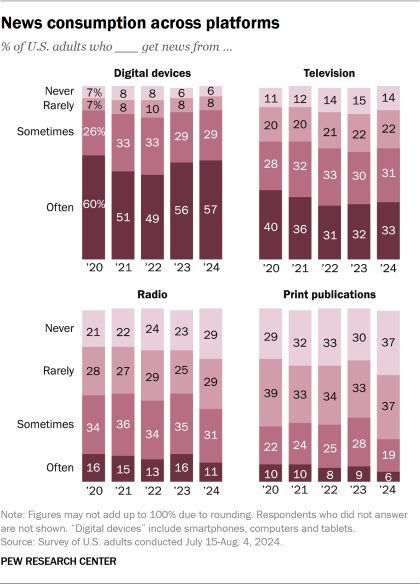
A large majority of U.S. adults (86%) say they at least sometimes get news from a smartphone, computer or tablet, including 57% who say they do so often. These figures are almost identical to the share who got news from digital devices in 2023.
Digital devices are by far the most common way Americans get news, although a majority (63%) get news from television at least sometimes. The portion of Americans who often get news from TV has stayed fairly steady over the last few years, now standing at 33%.
Americans turn to radio and print publications for news far less frequently. In 2024, just 26% of U.S. adults say they often or sometimes get news in print, the lowest number our surveys have recorded.
When asked which of these platforms they prefer to get news on, 58% of Americans say they prefer a digital device, far higher than the share who prefer TV (32%). Relatively few Americans prefer radio (6%) or print (4%).
News platform preferences
% of U.S. adults who prefer ____ for getting news
| Year | Digital devices | Television | Radio | Print publications |
|---|---|---|---|---|
| 2024 | 58% | 32% | 6% | 4% |
| 2023 | 58 | 27 | 6 | 5 |
| 2022 | 53 | 33 | 7 | 5 |
| 2021 | 50 | 36 | 7 | 5 |
| 2020 | 52 | 35 | 7 | 5 |
Note: “Digital devices” include smartphones, computers and tablets.
Source: Survey of U.S. adults conducted July 15-Aug. 4, 2024.
PEW RESEARCH CENTER

News across digital platforms
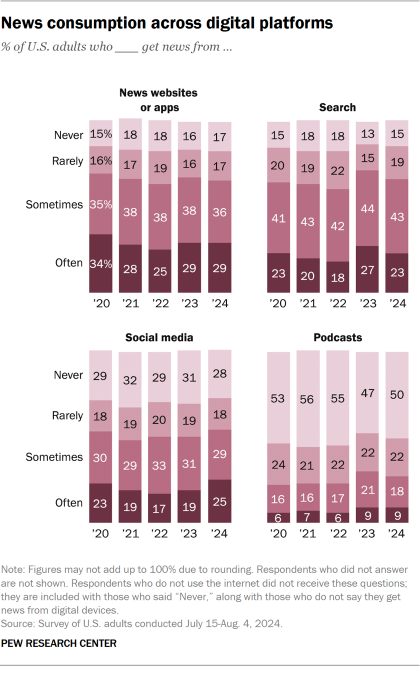
There are several different pathways Americans use to get news on their digital devices. News websites or apps and search engines are the most common: About two-thirds of U.S. adults at least sometimes get news in each of these ways. A little more than half (54%) at least sometimes get news from social media, and 27% say the same about podcasts.
News websites or apps are also the most preferred source for news. About a quarter of U.S. adults (23%) say they prefer to get their news this way, compared with 18% who prefer social media, 12% who prefer search and 5% who prefer podcasts. The share of Americans who prefer social media has increased by 6 percentage points since 2023.
Read more about how Americans get news on social media.
Digital news platform preferences
% of U.S. adults who prefer ___ for getting news
| Year | Search | News websites | Social media | Podcasts |
|---|---|---|---|---|
| 2024 | 12% | 23% | 18% | 5% |
| 2023 | 15 | 25 | 12 | 6 |
| 2022 | 12 | 23 | 13 | 4 |
| 2021 | 11 | 24 | 10 | 4 |
| 2020 | 12 | 26 | 11 | 3 |
Source: Survey of U.S. adults conducted July 15-Aug. 4, 2024.
PEW RESEARCH CENTER

Who uses each news platform?
News consumption across platforms varies by age, gender, race, ethnicity, educational attainment and political leaning. For example, Americans ages 50 and older are more likely than younger adults to turn to television and print publications for news – and less likely to use digital sources like social media or podcasts.
% of U.S. adults in each demographic group who get news at least sometimes from …
| Television | Radio | Print publications | Digital devices | |
| Total | 63% | 42% | 26% | 86% |
| Men | 61 | 42 | 25 | 86 |
| Women | 66 | 42 | 27 | 85 |
| Ages 18-29 | 46 | 27 | 18 | 91 |
| 30-49 | 51 | 43 | 19 | 91 |
| 50-64 | 72 | 51 | 26 | 87 |
| 65+ | 86 | 43 | 43 | 70 |
| White | 65 | 44 | 28 | 86 |
| Black | 75 | 43 | 26 | 83 |
| Hispanic | 60 | 38 | 21 | 85 |
| Asian* | 47 | 25 | 18 | 91 |
| High school or less | 69 | 42 | 26 | 77 |
| Some college | 63 | 42 | 24 | 89 |
| College+ | 57 | 42 | 28 | 92 |
| Rep/Lean Rep | 65 | 46 | 24 | 86 |
| Dem/Lean Dem | 63 | 39 | 29 | 87 |
Note: White, Black and Asian adults include those who report being only one race and are not Hispanic; Hispanic adults are of any race.
Source: Survey of U.S. adults conducted July 15-Aug. 4, 2024.
% of U.S. adults in each demographic group who get news at least sometimes from …
| News websites or apps | Social media | Search | Podcasts | |
| Total | 66% | 54% | 66% | 27% |
| Men | 68 | 49 | 65 | 30 |
| Women | 64 | 59 | 66 | 24 |
| Ages 18-29 | 62 | 78 | 74 | 34 |
| 30-49 | 70 | 64 | 70 | 34 |
| 50-64 | 71 | 45 | 65 | 23 |
| 65+ | 56 | 28 | 53 | 14 |
| White | 66 | 49 | 64 | 25 |
| Black | 64 | 58 | 70 | 29 |
| Hispanic | 64 | 67 | 65 | 31 |
| Asian* | 69 | 65 | 73 | 30 |
| High school or less | 55 | 54 | 60 | 22 |
| Some college | 66 | 57 | 68 | 27 |
| College+ | 76 | 52 | 69 | 32 |
| Rep/Lean Rep | 64 | 55 | 65 | 28 |
| Dem/Lean Dem | 70 | 55 | 68 | 27 |
Note: White, Black and Asian adults include those who report being only one race and are not Hispanic; Hispanic adults are of any race.
Source: Survey of U.S. adults conducted July 15-Aug. 4, 2024.
% of U.S. adults in each demographic group who prefer ___ for getting news
| Television | Radio | Print publications | Digital devices | |
| Total | 32% | 6% | 4% | 58% |
| Men | 29 | 6 | 4 | 60 |
| Women | 34 | 5 | 4 | 56 |
| Ages 18-29 | 8 | 2 | 3 | 86 |
| 30-49 | 18 | 6 | 3 | 72 |
| 50-64 | 42 | 8 | 3 | 46 |
| 65+ | 60 | 5 | 8 | 27 |
| White | 33 | 7 | 5 | 55 |
| Black | 43 | 3 | 3 | 50 |
| Hispanic | 27 | 3 | 3 | 66 |
| Asian* | 14 | 3 | 2 | 79 |
| High school or less | 41 | 5 | 4 | 49 |
| Some college | 32 | 5 | 3 | 59 |
| College+ | 21 | 6 | 5 | 67 |
| Rep/Lean Rep | 32 | 7 | 3 | 57 |
| Dem/Lean Dem | 30 | 5 | 5 | 59 |
Note: White, Black and Asian adults include those who report being only one race and are not Hispanic; Hispanic adults are of any race.
Source: Survey of U.S. adults conducted July 15-Aug. 4, 2024.
% of U.S. adults in each demographic group who prefer ___ for getting news
| News websites or apps | Social media | Search | Podcasts | |
| Total | 23% | 18% | 12% | 5% |
| Men | 25 | 17 | 12 | 6 |
| Women | 20 | 19 | 13 | 3 |
| Ages 18-29 | 19 | 43 | 17 | 6 |
| 30-49 | 27 | 22 | 16 | 7 |
| 50-64 | 26 | 7 | 10 | 3 |
| 65+ | 17 | 3 | 6 | 1 |
| White | 25 | 14 | 11 | 5 |
| Black | 15 | 20 | 12 | 3 |
| Hispanic | 18 | 31 | 13 | 4 |
| Asian* | 30 | 27 | 16 | 6 |
| High school or less | 13 | 19 | 12 | 4 |
| Some college | 21 | 19 | 14 | 5 |
| College + | 34 | 16 | 11 | 6 |
| Rep/Lean Rep | 21 | 18 | 13 | 6 |
| Dem/Lean Dem | 26 | 18 | 11 | 4 |
Note: White, Black and Asian adults include those who report being only one race and are not Hispanic; Hispanic adults are of any race.
Source: Survey of U.S. adults conducted July 15-Aug. 4, 2024.

Find out more
This fact sheet was compiled by Research Assistant Christopher St. Aubin and Research Analyst Jacob Liedke.
Read the methodology and the topline.
Pew Research Center is a subsidiary of The Pew Charitable Trusts, its primary funder. This is the latest analysis in Pew Research Center’s ongoing investigation of the state of news, information and journalism in the digital age, a research program funded by The Pew Charitable Trusts, with generous support from the John S. and James L. Knight Foundation.
Follow these links for more in-depth analysis of news consumption:
- Social Media and News Fact Sheet (Sept. 17, 2024)
- How Americans Get Local Political News (July 24, 2024)
- More than half of Americans are following election news closely, and many are already worn out (May 28, 2024)
- Americans’ Changing Relationship With Local News (May 7, 2024)
- How Hispanic Americans Get Their News (March 19, 2024)
- Americans are following the news less closely than they used to (Oct. 24, 2023)
- Black Americans’ Experiences With News (Sept. 26, 2023)
- For National Radio Day, key facts about radio listeners and the radio industry in the U.S. (Aug. 17, 2023)
- Podcasts as a Source of News and Information (April 18, 2023)
- The Role of Alternative Social Media in the News and Information Environment (Oct. 6, 2022)
Read all our reports and blog posts related to news platforms and sources.
CORRECTION (Oct. 16, 2024): The topline for this survey previously included incorrect figures (refer to topline for details). These have been updated in the topline and do not affect the overall findings in this analysis. Nothing on this page has been changed.