Automated call-in options may help reach respondents who are less tech savvy, but relatively few choose this option and logistical complications abound

Members of Pew Research Center’s American Trends Panel (ATP) complete all surveys online. Our goal was to determine whether adding the option to complete surveys through inbound interactive voice response (IVR) was feasible and if it would improve representation of less (digitally) literate and non-internet users.
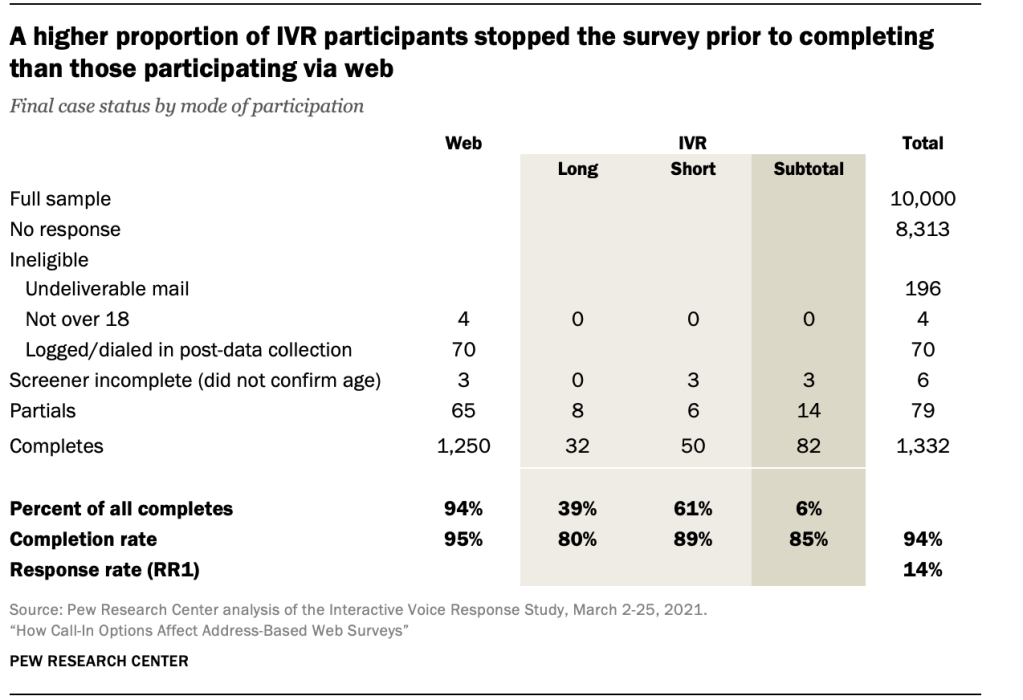
Pew Research Center tested the viability of adding an IVR data collection mode on a sample independent of the ATP. In March 2021, the Center mailed survey invitations to 10,000 residential addresses sampled from the United States Postal Service’s Computerized Delivery Sequence File. The invitation included $2 and asked potential respondents to participate in a short survey in the mode of their choice. They could either log in to a website and complete the survey online or dial a toll-free number to respond via interactive voice response. In the IVR mode, individuals listened to computer-recorded questions and response options and keyed in their answer (e.g., 1 for Yes or 2 for No). All participants who answered via web received the full questionnaire, while those who chose IVR were randomized between the same full questionnaire and an abbreviated version. Web respondents received an additional $15 upon completion, and IVR respondents received $10. In total, 1,332 individuals completed the survey, with 1,250 doing so by web and 82 via IVR.
About 7% of U.S. adults do not use the internet, 16% are not digitally literate, and half cannot read above an eighth-grade level. These attributes can make it difficult for many Americans to participate in a self-administered online survey. Moreover, non-internet and less literate (both in terms of reading level and computer savviness) individuals are not randomly distributed throughout the population. Rather, they are disproportionately likely to be older, have less formal education and live in rural areas, on average, than their counterparts. Missing them, in other words, harms the representation of online surveys and can introduce bias.
Meanwhile, a growing number of surveys, including those conducted on Pew Research Center’s American Trends Panel (ATP), can only be completed online. Online-only methods underrepresent the non-internet and less literate population, potentially increasing bias and misrepresenting variance in the data. Some web-only surveys attempt to account for the non-internet and less literate populations using weighting adjustments, while others provide internet access (as is done for the ATP) or an alternative mode of data collection to individuals without internet access. But these are imperfect solutions. Weighting relies on assumptions about the similarities between internet and non-internet populations that may be faulty. Providing internet access does not address literacy challenges and may not be successful in recruiting individuals who consciously choose to be offline. And the introduction of some additional modes (such as live telephone interviewing) may introduce interviewer effects or (in the case of mail) be infeasible due to timelines and budgets.
One method to improve representation of the non-internet and less literate population is to allow people to take surveys in an offline mode that does not require reading but is still self-administered. In March 2021, the Center fielded a study to test the feasibility and effect of collecting data through inbound (respondent-initiated) interactive voice response (IVR) in addition to the internet. An invitation was mailed to 10,000 addresses and gave individuals the choice of completing the survey online or dialing a toll-free number to respond via IVR. In the IVR mode, individuals listened to computer-recorded questions and response options and keyed in their answer using their phone. In total, the study yielded 1,332 completed interviews, 1,250 via web and 82 via IVR.
The study yielded three primary findings:
- Collecting responses through IVR is much more logistically complex than web-based data collection. However, the challenges associated with adding an IVR mode appear to be surmountable with additional experimentation and resources.
- Individuals who respond via IVR are different than those who answer via web and better represent groups (e.g., conservatives, adults with less formal education) that the ATP and other online panels have historically underrepresented. Unfortunately, the proportion of respondents in this test choosing to respond via IVR (6%) instead of online is too small to meaningfully shift the overall distributions of participants in a panel like the ATP.
- Data quality from inbound IVR may not be as high as that from online response, but that finding is tentative for three reasons. The IVR estimates are subject to sizable sampling errors because only 82 respondents chose that mode. Also, by design, mode was not experimentally assigned. The fact that IVR attracted a different set of respondents, with less education than web may account for at least some of the data quality differences between the two modes. Finally, this was the Center’s first time testing inbound IVR, and it is possible that further refinements in the protocols could achieve results more favorable to IVR.
In 2020, about 12% of national preelection polls used IVR either as the sole response mode or in combination with another mode like online. In almost all instances, these polls used outbound IVR. The study summarized in this report tested a similar but distinct approach called inbound IVR. The terminology flows from the perspective of the person conducting the survey. With outbound IVR, the automated calls are initiated by the researcher and go out to each of the phone numbers sampled for the survey. From the respondent’s perspective, their phone rings (or the call is blocked); they have received a cold call to take an automated survey. By contrast, the inbound IVR process tested here starts with the sampling of home addresses. The sampled addresses were mailed a letter with $2 and a request to take a survey either online or by calling in to take the automated survey. From the respondent’s perspective, they can choose how and when they respond.
The addition of IVR as a method to improve representation of the non-internet and less literate population in online panels is promising, but additional research is needed to streamline the survey deployment process, reduce costs and increase the proportion of IVR respondents. For example, while this study sheds light on the potential biases associated with online-only panels and provides some evidence of the potential for IVR, it does not include a way to determine the proportion of IVR participants who would ultimately agree to empanelment (i.e., participate in repeated surveys), nor does it determine whether these individuals may be recruited to the panel via alternative modes (e.g., mail or live phone) and retained by allowing response to individual panel surveys via IVR. Additionally, the study is limited to English speakers, so it does not address the feasibility of recruiting underrepresented groups within the Spanish-speaking population. We hope that researchers outside of the Center may use the knowledge gained in this study to further develop best practices on how to incorporate IVR.
IVR presents difficult but surmountable challenges in programming and implementation
There are several challenges that make implementing IVR more difficult than some other modes.
First, some survey platforms (the software used to collect and manage survey data) are not suitable for both web and IVR administration. As a result, the IVR and web instruments have to be programmed twice, using different platforms for each mode. In our case, systems were synced nightly to minimize the risk that individuals completed the survey in both modes. However, the lack of live integration meant duplicate interviews were possible (this happened 14 times), and respondents could not start in one mode and complete in a different mode without having to start over. Having multiple platforms also creates a need for manual intervention to provide data collection monitoring (e.g., the data collection dashboard could not track IVR partial interviews) and doubles both the programming and testing resources required (i.e., cost and time) and the chances of programming errors.
Second, unique features of the IVR software require special consideration. For example, the software cannot easily randomize question wording differences. Center researchers often field questions in which the response options are shown in a randomized order. One respondent may be asked a question that offers “strongly agree” as the first answer choice and “strongly disagree” as the last, whereas another respondent would receive the choices in reverse order. For IVR, a separate question has to be programmed for every order combination, and the resulting variables have to be recombined into a single variable after data collection.
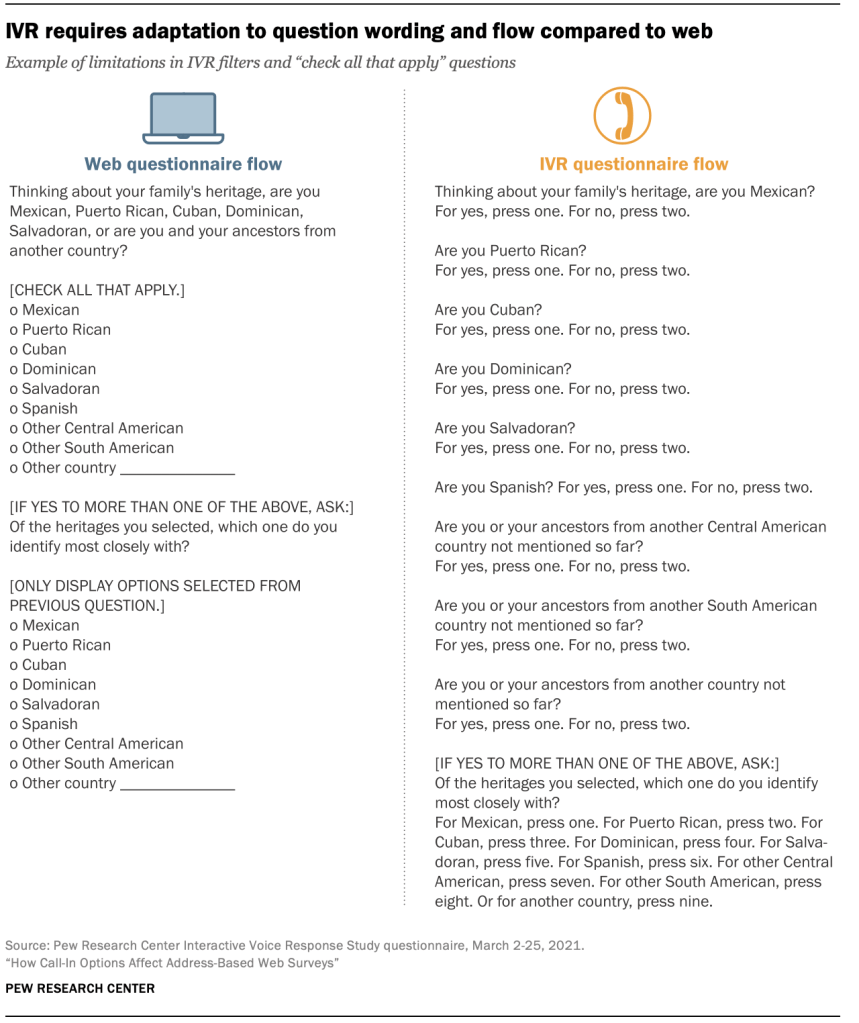
The software also cannot filter response options based on prior responses without complex programming. For this study, this limitation affected how Hispanic origin was collected. Individuals who self-identified as Hispanic were asked to provide their Hispanic origins (e.g., Cuba, Mexico). If they selected multiple countries, respondents were asked with which one they most closely identify. In the web survey, response options to the follow-up question were limited to those responses chosen in the first question. For IVR, individuals could (though none did) say they most identified with a country that they had not previously listed.
Third, the software requires multiple types of changes to the ways in which questions are worded. “Check all that apply” questions (a single question in which respondents can select more than one answer) are not feasible in IVR, so edits are made to repeat the stem or start of these types of questions and then ask a yes-no question about each response option.
Another common question format on Center surveys are questions for which the response options are part of the question (e.g., “Do you currently identify as a man, a woman, or in some other way?”). To minimize repetition, the researchers added instructions into the IVR question (e.g., “Do you currently identify as a man? Press one. For a woman, press two, or for some other way, press three”).
Some questions commonly asked at the Center have a long list of response options (e.g., online, respondents are provided 12 response options when asked for their religion). In IVR, respondents are required to listen to all response options before answering in order to minimize order effects and speeding. All of these examples increase respondent burden, which may increase breakoffs or measurement error due to satisficing.
Fourth, open-ended questions (those that respondents answer in their own words) are difficult in IVR. For the feasibility test, some open-ended questions were dropped from the IVR version. For example, if an individual reported being of a race other than those specified, the web version provided a text box for the respondent to type in their answer. Researchers later back-code the open-ended text into preexisting categories. In our study, 5% of web respondents selected “some other race or origin,” of which 28% entered text that was coded back to another race group and changed the assigned race category the Center uses for analysis. By eliminating the open-ended response for the IVR mode, race and similar variables cannot be back-coded, artificially increasing the proportion of respondents identifying as another race.
Some open-ended questions cannot be eliminated (e.g., name for which to address the incentive check). In these cases, respondents were asked for a verbal response, which was later manually transcribed. Manual transcription was feasible given the limited number of open-ended responses and IVR respondents, but this approach may not be scalable. There was also some concern that manual transcription would result in misspellings that would require checks to be reissued, but no such concerns materialized.
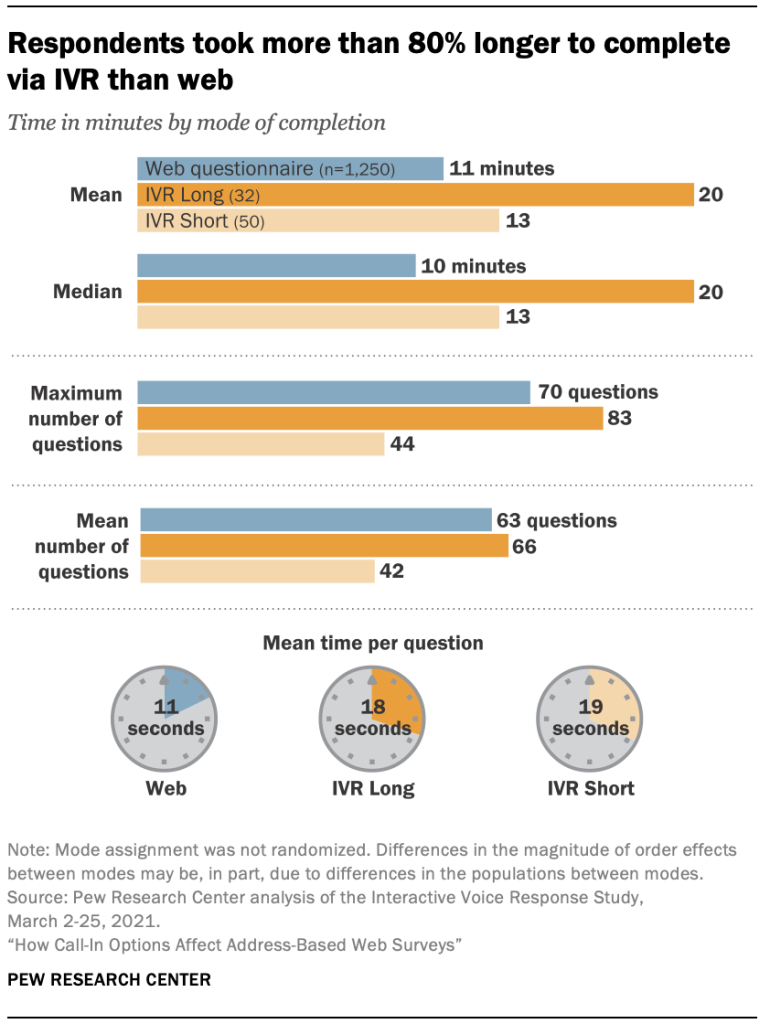
Fifth, IVR surveys take almost twice as long to complete as web surveys. IVR respondents in our study were randomly divided into two groups – one group received a long form (max of 83 questions) and the other received a short form (max of 44 questions). Web respondents and those assigned to the IVR long form received the entire questionnaire, whereas short form respondents received an abbreviated questionnaire. Whereas web respondents took an average of 11 minutes to complete the entire survey, it took 20 minutes to complete via IVR. This is in part due to the number of additional questions required to collect the same information in IVR (e.g., asking Hispanic origin is one question online but nine questions via IVR). Each IVR question also takes around 1.6 times as long to administer and collect a response as the same question asked online (18 seconds vs. 11 seconds for IVR long form and web, respectively). IVR respondents are required to listen to the entire question and all response options before they can select an answer, whereas web respondents have no time constraints imposed on them.
Sixth, the Center requested that the IVR voice be automated, not recorded by a live human. ATP surveys often require last-minute questionnaire changes, and the person who initially records a question may not be available on a tight timeline to implement the changes in IVR. Additionally, consistency is important across ATP surveys, and the same individual who records one survey may not be available for a later survey. Automated text-to-voice applications do not suffer these limitations. Automation also provides flexibility to control the speed of administration.
But automated voices come with their own challenges. Emphasis or stress on a particular word is not possible in the IVR platform used for this study (underlining or ALL CAPS are used to provide emphasis online), placing additional cognitive burden on respondents. The use of automation also requires precise placement of punctuation. If punctuation is incorrect, the automated voice does not pause in the appropriate places. In this study, several iterations of the questionnaire were required just to address punctuation placement.
Logistically, several improvements would be needed before IVR could be reasonably implemented as an additional mode for the ATP. Surveys would need to be moved to a platform that could field both web and IVR surveys. The platform would need to be able to easily randomize question and response option order, implement complex filters and skip logic and be able to adjust emphasis on specific words. Staff would need to be trained to write questions that could be fielded in both web and IVR and trained to format them to allow the computer to properly pause and stress words in a manner consistent with human speech patterns. Additional experimentation would be required to ensure that adaptations in question wording do not break trends and produce reasonably reliable and unbiased data. Each panel is different, but we believe most of these requirements would hold for other online panels as well.
IVR improves recruitment of non-internet and less literate individuals
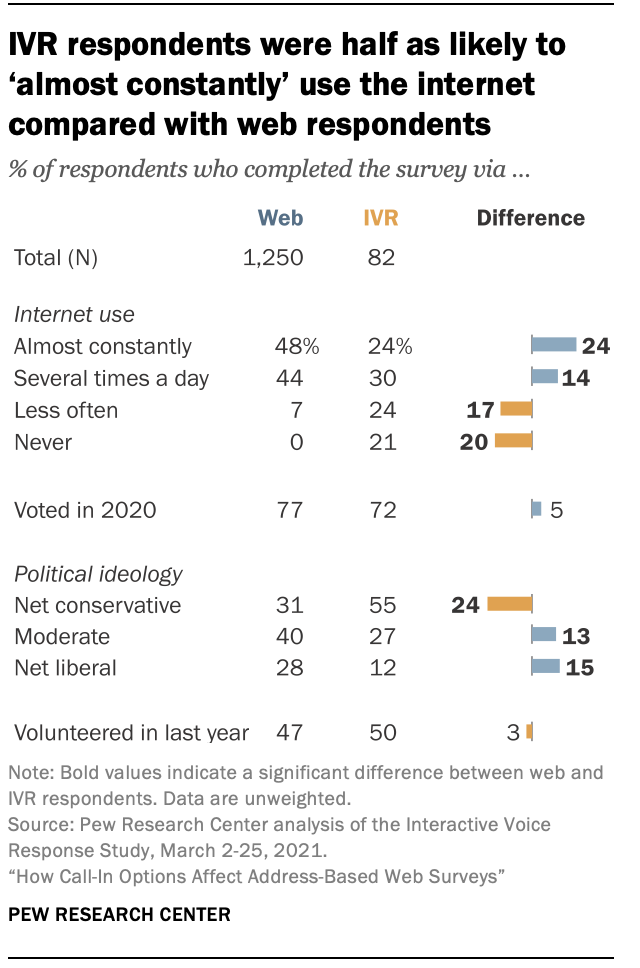
As one might expect, IVR is more effective than web surveys at gaining participation from less tech-savvy adults. Nearly half (45%) of all IVR respondents in our study reported infrequent (less than several times per day) or no internet use. This compares to just 7% of web respondents.
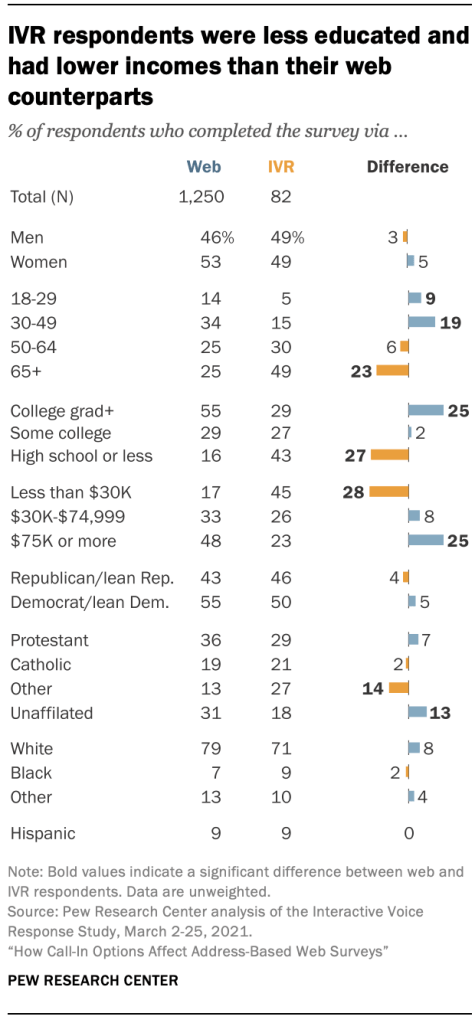
While direct measures of literacy were not collected, IVR respondents are different on several metrics correlated with both internet use and literacy. They are nearly twice as likely to be age 65 or older and more than 2.5 times as likely to have a high school education or less or to make $30,000 or less in household income than their web counterparts. IVR respondents are also more likely to identify as politically conservative than web respondents. While individuals age 65 and older are already well represented on the ATP, the ATP significantly underrepresents individuals with less education and lower incomes. If the number of respondents recruited via IVR were large enough, it could rectify the skew in education and income on the panel.
While IVR was successful in recruiting individuals from many groups traditionally underrepresented on the ATP, the success was not universal. For example, the ATP underrepresents young adults (ages 18 to 29) and less socially engaged individuals (e.g., people who do not volunteer and/or vote). Only 5% of IVR participants are ages 18 to 29, compared with 14% in the general population, and 72% of IVR respondents report voting in the 2020 general election, compared with the actual turnout of 66%. Neither of these findings are surprising. Younger adults are more likely to be online and opt for web over IVR. IVR, like all self-administered modes, also requires significant initiative from the respondent, something less likely to be taken up by less engaged individuals.
While the addition of IVR appears to be successful at recruiting individuals different from those who respond via web, our survey did not recruit enough of them. A total of 1,332 respondents completed the survey yielding a response rate of 13.7% (AAPOR RR1).1 Nearly all respondents (94%) opted to complete via web, with only 82 completing via IVR.
A slightly larger share of invited individuals opted to start IVR (7%), but IVR suffered from a higher breakoff rate. Whereas 95% of individuals who screened into the web survey completed it, only 80% of those who received the IVR long form and 89% who received the IVR short form completed. This is not surprising given that the IVR survey (even the short form) took longer, on average, to complete, and response rates are indirectly correlated with survey length(as length increases, response rates decrease). Unfortunately, it suggests additional improvements need to be made to increase the initiation rate (i.e., the proportion of people who start the survey) among the types of people who may lean toward IVR (as opposed to web) response. It also suggests that the IVR survey may need to be shorter or incentives may need to be larger to improve the IVR completion rate.
One methodological change that would ensure more individuals complete the survey via IVR is elimination of the web option. However, this approach would likely lower the overall response rate since many people prefer completing online. Moreover, IVR is useful insofar as it recruits individuals who would otherwise not participate. The goal should not just be to increase the number of responses obtained via IVR but to improve the number of responses from the types of people that prefer IVR.
Ultimately, while the IVR mode shows promise, more research is needed before it can qualify as a feasible mode for the ATP (and, likely, other online panels). In particular, while the addition of IVR would recruit individuals currently underrepresented on the ATP, the proportion of IVR as a share of total respondents is too small to meaningfully improve representation on the ATP. Response rates among individuals who would be more inclined to answer in IVR (as opposed to web) need to be increased. Also, experimentation to improve the productivity of the IVR mode may include: incentivizing IVR more than web; limiting the IVR questionnaires to a subset of the web questionnaire; only including items for which bias is known or suspected (data from IVR-inclined respondents is most valuable if they offer answers different from the web respondents); reducing the survey length and improving completion rates; or considering different data collection protocols such as recruiting via mail and transitioning to IVR after empanelment.
IVR data quality appears acceptable, but is not as high as in web surveys
Some researchers have raised concerns about poor IVR data quality. Multiple analyses of the study data reveal that inbound IVR data quality may be sufficient but not as high as the data quality observed in the web survey. However, the findings are not conclusive. The mode of administration was not randomized; individuals could choose in which mode they wished to respond. This confounds population differences with mode effects. Moreover, the variance in estimates among the IVR sample was large due to the small sample sizes, limiting the ability to detect true differences. Finally, design choices in web and IVR were made to maximize data quality. For example, IVR respondents were required to listen to all response options before entering an answer to mitigate satisficing. To the extent that different design choices are made in other surveys, data quality may differ.
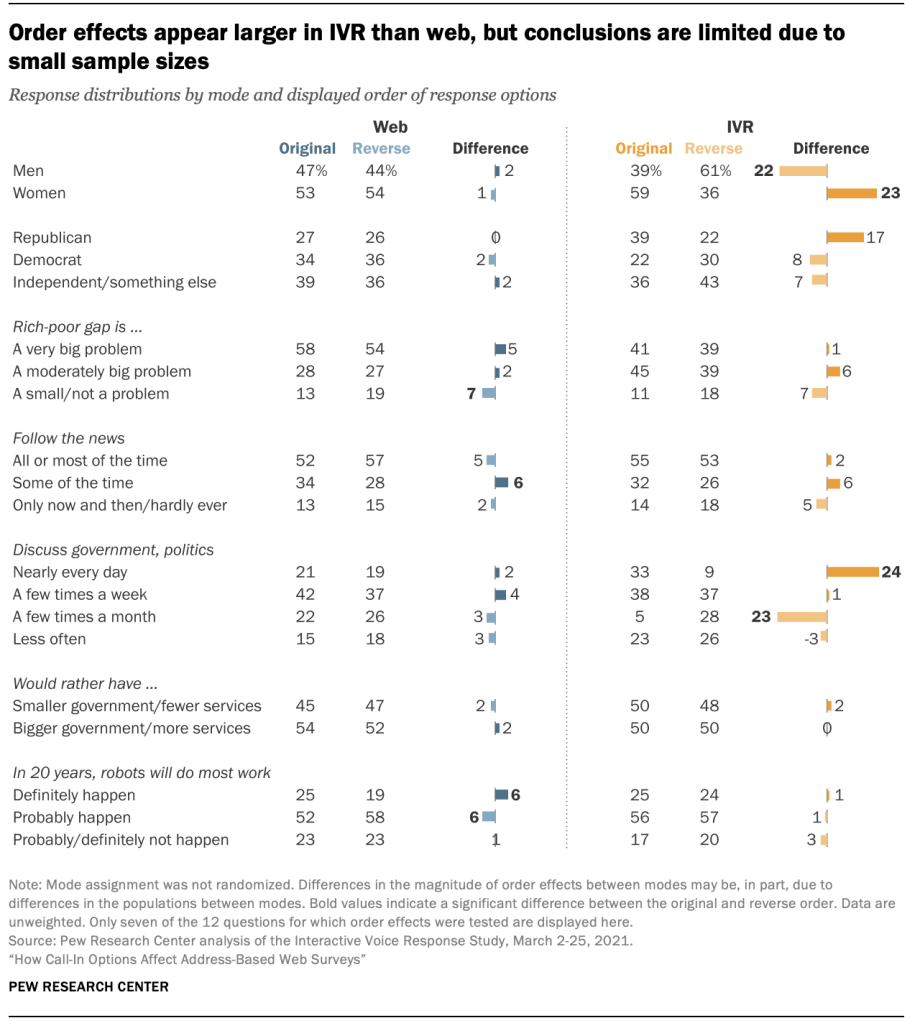
Some respondents are prone to order effects in self-administered modes. The order of the response options was randomized (first to last vs. last to first) for seven variables for both web and IVR2. Order effects were relatively consistent between modes for four of seven variables. However, three variables were susceptible to large (over 10 percentage points) order effects in IVR that were not observed among web responses: frequency with which individuals discuss government and politics, gender, and party identification. As noted before, the sample sizes for the IVR case counts are small (approximately 40 per group), so small changes in the distribution (regardless of the significance) can create large percentage point differences. IVR may also be more susceptible to satisficing later in the survey. Additional testing with larger samples, additional IVR questionnaire lengths, and placement of the questions is required before more conclusive inferences can be drawn. While order effects are less than ideal, randomization of the response order creates noise but can eliminate bias among these variables. Ultimately, even if the observed order effects are determined to be real, they can be accounted for and are not insurmountable.
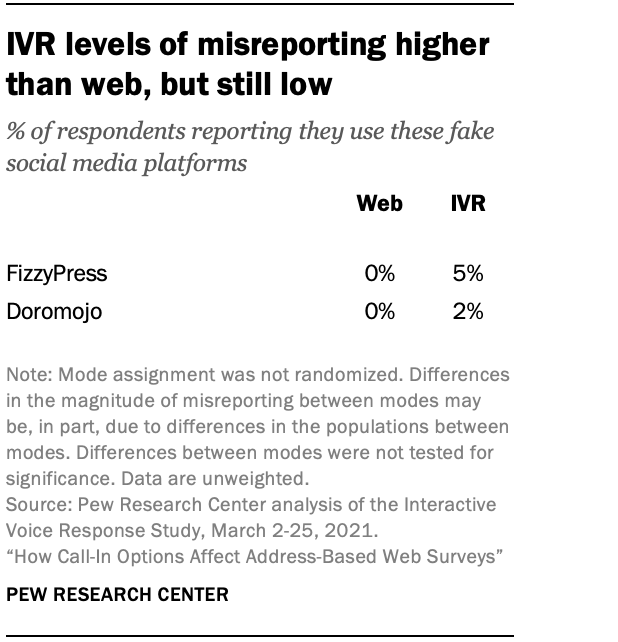
Given the amount of time it takes to complete an IVR survey (compared with a web survey) and the lack of engagement from a live interviewer, IVR respondents may be more likely to satisfice, the act of selecting any reasonable response option. Two questions were included in both the web and IVR modes to identify satisficing. Respondents were asked if they used the non-existent social media platforms FizzyPress and Doromojo. All respondents should have selected “no,” but three IVR respondents reported using FizzyPress and one reported using Doromojo. These levels of inaccurate reporting are low, but should be monitored among a larger sample size.
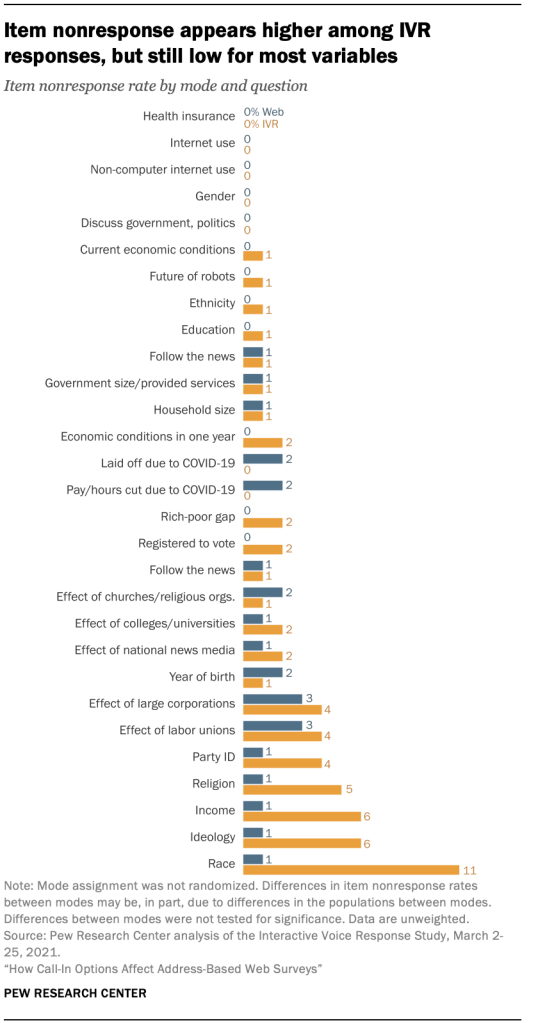
There was also concern that respondents may be more inclined to skip questions or select an answer at random in IVR because they had missed part of the question and did not want to wait for it to repeat. The latter (select an answer at random) could not be evaluated. To measure the former, 28 questions fielded to all respondents (both the IVR short and long form) were evaluated for item nonresponse. Four had an item nonresponse rate of 5% or higher on IVR; none reached that level on web. A total of 11% of IVR respondents refused to provide a race. Race was a “check all that apply” question in web that had to be modified for IVR and became cumbersome to respondents. Further refinements (for example, “What is your race or origin? For White, press one. For Black or African American, press two. For Asian or Asian-American, press three. For any other race or if you are multi-racial, press four”) may reduce the item nonresponse rate. The nonresponse rate for religion (5%) would also likely be reduced by editing the question – specifically, reducing the number of response options from 12. Income suffered from high nonresponse (6%). However, income is typically the most refused item in U.S. surveys, and this nonresponse rate is well below that found elsewhere. Ideology is the only question for which additional investigation may be warranted.
In all, some question edits may help improve the data quality among IVR respondents. Additional testing should be conducted on larger samples to provide more precise estimates of order effects, misreporting and item nonresponse. But none of the findings here would prevent IVR from being added to the ATP.
