by Carroll Doherty

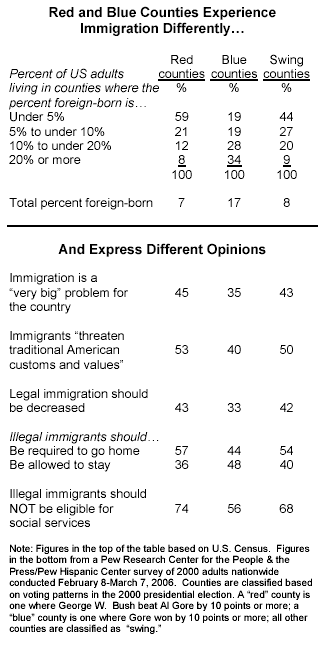
The immigrant population of most predominantly Republican “red” counties and swing counties is relatively small. Yet residents of red and swing counties are significantly more opposed to immigration – both legal and illegal – than are residents of predominantly Democratic “blue” counties, where immigrants are much more populous.
The overall population of red counties is 93% native-born, with just 7% born outside the U.S. Fully 59% of red-county residents live in places where fewer than one-in-20 people are foreign-born. By contrast, blue counties have more than twice as many foreign-born residents (17% overall); about one-in-three blue-county residents (34%) live in areas where foreign-born people make up a fifth or more of the total population.
The demographic makeup of politically contested swing counties is far more similar to Republican parts of the country than Democratic areas. Just 8% of the population in highly contested counties was born outside the U.S., and a 44% plurality lives in areas where fewer than one-in-20 are foreign-born.
About half of the residents of both red and swing counties believe that immigrants threaten American customs and values. And a solid majority of those in red counties (57%), and nearly as many people living in swing counties (54%) believe that immigrants living in the U.S. illegally should be required to go home. That compares with 44% of people living in blue counties.
Similarly, roughly four-in-ten of the residents of red (43%) and swing counties (42%) say that the level of legal immigration into the U.S. should be reduced; just a third of those in blue counties agree (33%). Notably, on most of these measures, attitudes of swing-county residents are closer to those of people in red counties rather than in blue counties.
Partisanship is evident in these attitudes, and the fact that immigrants themselves are more populous in blue counties no doubt contributes to the more pro-immigrant views in these areas. But these differences also reflect the fact that people in areas with relatively low concentrations of foreign-born people are more likely generally to see immigrants as a burden to the nation and a threat to American customs (see America’s Immigration Quandary).
Red-County Divisions

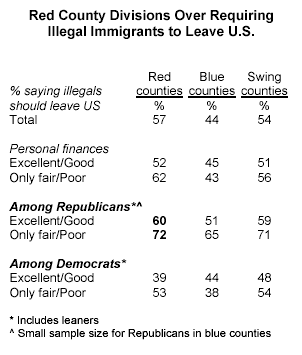
Earlier Pew analysis has shown that opinion on immigration is divided along socioeconomic, as well as partisan, lines. Within both party coalitions, financially insecure and less educated people are generally more likely to hold negative views of immigrants and favor more strict policies than do the financially secure and college graduates. However, on the important question of whether illegal immigrants should be allowed to stay in the United States, or required to leave, these differences are greater among red-county residents than among those living in blue counties.
Most strikingly, among the biggest divides over immigration policy is between red- county Republicans who take a dim view of their own finances and financially stressed Democrats in blue counties – a group that includes many immigrants. Nearly twice as many in the former group as in the latter favor requiring illegal immigrants to go home (72% vs. 38%).
Roughly half of the residents of red counties who have a positive view of their personal finances (52%) say illegal immigrants should be required to leave the U.S.; that compares with 62% of those who say their financial situation is fair or poor. Among Republicans in red counties, support for requiring illegals to leave is even broader, though the economic differences are comparable. Six-in-ten red-county Republicans who rate their financial situations as good or excellent say all illegal immigrants should leave; fully 72% of those with an unfavorable view of their personal finances agree. In blue counties, there are virtually no differences in these attitudes among those who see themselves as well-off and those who say they are struggling financially; the modest differences among Democrats are not statistically significant.


