Overview
In the final days before Tuesday’s election, most of the focus will be on those likely to cast votes. But a sizable minority of adults choose not to vote or are unable to vote. By their absence, they also will

affect the outcome. Nonvoters are numerous; in 2008, they constituted about 43% of the voting age population.
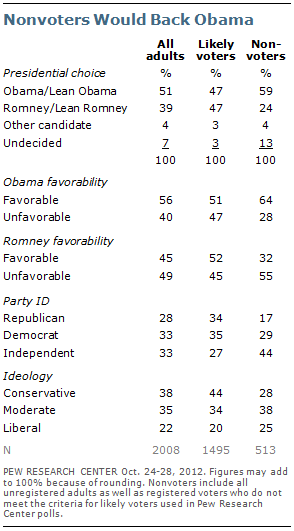
Nonvoters favor Barack Obama over Mitt Romney by a wide margin (59% to 24%). While most nonvoters (64%) have a favorable view of Obama, just half as many (32%) view Romney favorably.
By contrast, likely voters are evenly divided in Pew Research’s most recent national survey (47% Obama, 47% Romney). Nearly identical percentages of likely voters view Obama and Romney favorably (51% Obama, 52% Romney).
A plurality of nonvoters are independents (44%); 29% identify as Democrats and just 17% as Republicans. Likely voters include about the same percentages of Democrats (35%) as Republicans (34%); 27% of likely voters are independents.
About half of nonvoters (52%) either identify as Democrats or lean Democratic; only 27% identify as Republicans or lean Republican. Likely voters’ leaned party identification is evenly divided: 47% identify with the Republican Party or lean toward the GOP, while the same percentage identify as Democrats or lean Democratic. However, just a quarter of nonvoters describe their political views as liberal; that is little different from the percentage of liberals among likely voters (20%). But nonvoters are far less likely than voters to describe their political views as conservative (28% vs. 44% of likely voters).
As might be expected, nonvoters express very little interest in politics or the election. A third of nonvoters say they are registered to vote. But they are far less likely than voters to give a lot of thought to the election and follow public affairs.

Demographic Differences Between Voters, Nonvoters
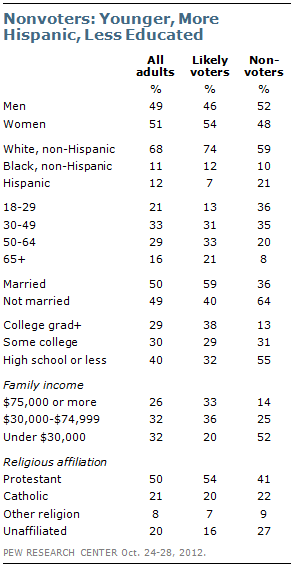
Nonvoters are younger, less educated and less affluent than are likely voters. More than a third (36%) of nonvoters are younger than 30, compared with just 13% of likely voters.
Just 13% of nonvoters are college graduates and about the same percentage (14%) have family incomes of $75,000 or more. Among likely voters, 38% are college graduates and a third (33%) have family incomes of $75,000 or more.
While most voters are married, most nonvoters are not. Nearly two-thirds (64%) of nonvoters are unmarried, compared with 40% of likely voters.
Nonvoters also are much more likely than voters to be Hispanic: 21% of nonvoters are Hispanic, which is three times the percentage of Hispanics among likely voters (7%). About six-in-ten (59%) nonvoters are white non-Hispanics. By contrast, white non-Hispanics make up about three quarters (74%) of likely voters.
Nonvoters and Voters on the Issues
Nonvoters express more liberal opinions than voters on a wide range of domestic and foreign policy issues. But the differences are far less pronounced on social issues, such as gay marriage and abortion.

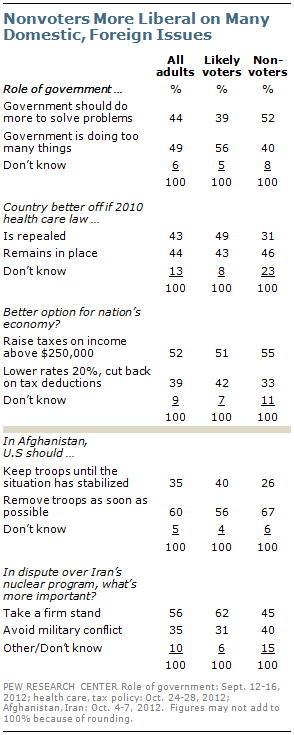
Far more nonvoters than voters favor activist government. About half of nonvoters (52%) say the government should do more to solve problems, while 40% say the government is doing too many things better left to businesses and individuals. The balance of opinion is reversed among likely voters: 56% say the government is doing too much, while 39% say the government should do more to solve problems.
By 46% to 31%, more nonvoters favor keeping the 2010 health care law in place than repealing the law; 23% do not express an opinion. Voters are more evenly divided, with 49% favoring the law’s repeal and 43% saying it should remain in place; just 8% do not express an opinion.
There are smaller differences in the opinions of voters and nonvoters on tax policy: 55% of nonvoters and 51% of likely voters say it would better for the economy to maintain current tax rates on income under $250,000 while raising taxes on income about that level. A third of nonvoters, and 42% of likely voters say it would better to lower tax rates for all Americans by 20%, while limiting some tax deductions.
On foreign policy, a clear majority of likely voters (56%) favor withdrawing U.S. forces from Afghanistan as soon as possible; 40% say they should remain until the situation there is stabilized. Support for an immediate withdrawal is even more widespread among nonvoters (67% favor).
Nonvoters also are less supportive of taking hard line against Iran’s nuclear program: 45% say it is more important to take a firm stand against Iran, while 40% say it is more important to avoid a military conflict with Iran. Among likely voters, 62% favor taking a firm stand against Iran while just 31% say it is more important to avoid a military conflict.

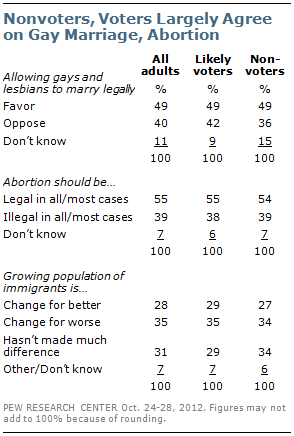
On gay marriage and abortion, however, there are at most modest differences between nonvoters and likely voters. And there are no significant differences in opinions about the impact of immigrants on the country.
Identical percentages of nonvoters and likely voters favor allowing gays and lesbians to marry legally (49% each). Somewhat fewer nonvoters oppose gay marriage (36% vs. 42% of voters ), while more have no opinion (15% vs. 9%).
Nonvoters have the same views on abortion as likely voters: 54% of nonvoters say abortion should be legal in all or most cases, while 39% say it should be illegal in all or most cases. Among likely voters, 55% favor legal abortion in all or most cases; 38% say it should be mostly illegal.
Like voters, nonvoters express mixed opinions about the impact of the growing population of immigrants on the U.S.: 27% say it has been a change for the better, 34% a change for the worse, while 34% say it has not made much difference.