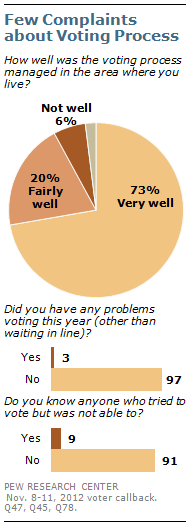
Most voters offer a positive assessment of the voting experience, with relatively few criticisms aside from the occasional long lines at polling places. And most remain confident that their vote was accurately counted, and that the voting process in their area was managed well.
But the proportion of voters – both on the winning and losing side – expressing a high degree of confidence in the accuracy of the nationwide vote count has fallen significantly since 2008.
Most voters (73%) say that the voting process in their area was managed “very well” and 20% say it was managed “fairly well.” Just 6% say it was not managed well. Obama and Romney voters give similar assessments of the voting process. Voters in solidly red, solidly blue, and battleground states do not differ on this question.
About one-in-ten voters (9%) say that someone they know tried to vote but was unable to do so. The percentage is somewhat higher among black voters (14%) and those younger than 30 (21%). When voters are asked why that person was unable to vote, no one reason stands out. Of note, very few cite Hurricane Sandy as the reason, and a similarly small number cites long lines at polling places.
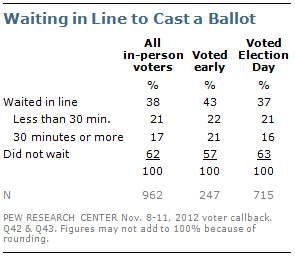
Among those who voted in person either early or on Election Day, 38% report having had to wait in line to cast their ballot. That is comparable to voter reports from previous election cycles. In 2008, 36% said they had to wait in line. In 2004, 42% of Election Day voters reported having waited in line.
Of those who had to wait, about half say the wait was less than 30 minutes. Overall, 17% of in-person voters report having had to wait 30 minutes or more to cast a ballot. Those voting in person before
Election Day were about as likely to report having a long wait as those who voted on Election Day.
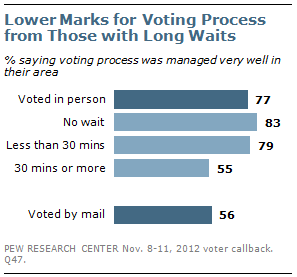
Not surprisingly, waiting in line is associated with how people rate the voting process in their area. Just over half (55%) of voters who had to wait a half-hour or more say the voting was managed “very well” in their area, compared with 79% of voters who waited for less than that, and 83% of those who didn’t have to wait at all. And just 56% of those who mailed in their ballot say the voting process was managed very well in their area.
The Accuracy of the Vote
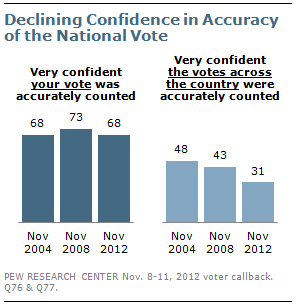
Most voters are confident that their own vote was accurately counted, but there is less confidence in the accuracy of the vote count across the country. Overall, 68% say that they are very confident that their own vote was accurately counted, but just 31% express the same level of confidence about the vote count nationally.
There has been little change in voters’ assessments of their own vote over the past decade; the 68% who are very confident their vote was accurately counted this year is comparable to the share of voters who said this after the 2004 election (68%), though is down slightly from 2008 (73%).
But confidence in the vote count nationwide has been slipping: Just 31% of voters this year say they are very confident the votes across the country were accurately counted, down from 43% after the 2008 election and 48% after the 2004 election.
Early voters are slightly less convinced that their own vote was counted accurately: Roughly two-thirds (64%) are very confident their vote was counted, whether they voted early in person (64%) or by mail (65%). Among those who cast their ballot on Election Day, 71% are very confident their vote was counted accurately.
About seven-in-ten (73%) Obama voters are very confident their vote was counted accurately, compared with 64% of Romney voters. This is similar to the pattern seen among Bush and Kerry voters in 2004, when supporters of Kerry, the losing candidate, were less confident that their vote was registered. Four years ago, there was no difference between Obama and McCain voters in confidence about this.
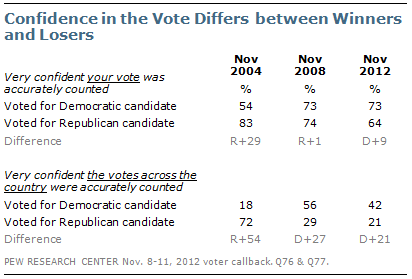
This year, 42% of Obama voters say they are very confident in the national vote count, but only 21% of Romney’s voters do so. The losing candidate’s supporters also expressed less confidence than the winning candidate’s supporters in the past two elections. But even the confidence of the winning candidate’s supporters has declined markedly since 2004. That year, 72% of Bush’s voters said they were very confident that votes across the country had been accurately counted. Four years ago, 56% of Obama’s voters were very confident. Today, just 42% of Obama voters express this same level of confidence in the accuracy of the vote nationwide.
Early Voting Inches Up, But No Surge in 2012
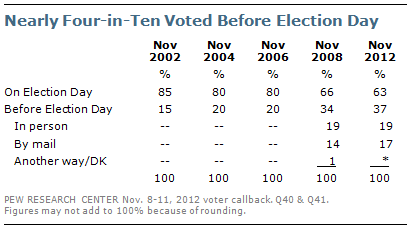
After a dramatic 14-point jump in 2008 in the proportion of voters casting a ballot before Election Day, the 2012 election saw only a modest change in early voting. Overall, 37% of voters say they voted early, compared with 34% four years ago. The same percentage as in 2008 reported voting early in person (19%), while 17% reported voting by
mail this year (compared with 14% in 2008).
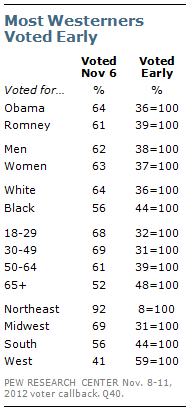
Obama’s and Romney’s supporters were about equally likely to vote before Election Day: 36% of Obama’s supporters say they voted early, compared with 39% among Romney’s voters.
There are significant geographic differences in whether voters cast their ballots early or on Election Day. About six-in-ten (59%) voters in the Western U.S. voted early; most of them voted by mail rather than in person. Early voting was popular in the South as well, where 44% cast their vote before Election Day.
Voter accounts of when they made a final vote decision suggest that Hurricane Sandy had little impact
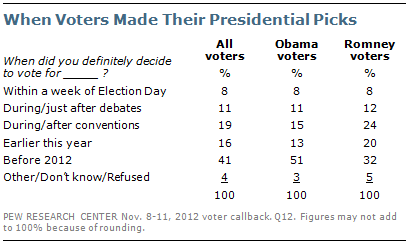
on the outcome of the election. For all the attention paid to the hurricane and President Obama’s handling of its aftermath, just 8% of voters say they made up their mind within a week of the election, and these late deciders made up the same share of each candidate’s supporters.
As is typical in elections featuring an incumbent, many Obama supporters (51%) made up their minds to vote for him before 2012. Not surprisingly, fewer Romney backers (32%) made up their minds that early, though 52% had decided prior to the party conventions. Roughly three-quarters of both candidates’ supporters made up their minds before the debates began.
Few Get Political Messages at Church
Among voters who attend religious services at least once a month, 13% say information on political parties or candidates for the election was made available in their place of worship. This is comparable to the percentage receiving such information in 2008 (15%), and is lower than the percentage in 2004 (27%).
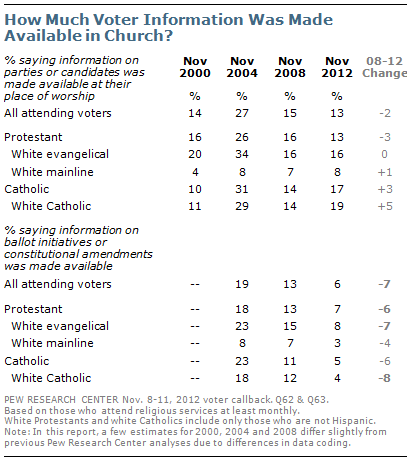
White evangelical Protestant voters (16%) and white Catholic voters (19%) are more likely to report having information on political parties or candidates available in their churches than are white mainline Protestant voters (8%).
Far fewer voters had information on local ballot initiatives or constitutional amendments available in their places of worship.
Among all voters who attend religious services at least once a month, only 6% say information on ballot initiatives or constitutional amendments was made available in their places of worship, down from 13% in 2008 and 19% in 2004.
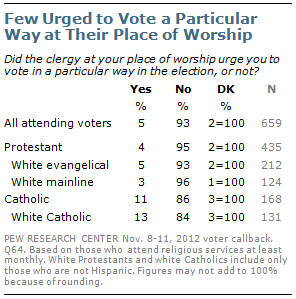
Very few voters who attend religious services monthly or more say they were urged by their clergy to vote a particular way in the election. Only 5% report hearing such explicit endorsements, while 93% say they did not. Among all voters who attend religious services, 3% say they were urged by their clergy to vote for Republicans, and less than 1% say they were urged to vote for Democrats.
Catholic voters who attend church regularly are more than twice as likely as Protestants to report being urged to vote a certain way. (11% vs. 4%). Among white Catholics, 13% say they were urged to vote a particular way by their clergy, compared with 5% of white evangelical Protestants and 3% of white mainline Protestants.
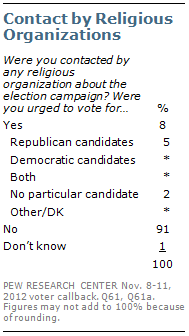
Among Catholic voters overall, 6% say they were encouraged by their clergy to vote for Republican candidates, while none say they were urged to vote for Democratic candidates.
Overall, 8% of voters say they were contacted by any religious organization about the election campaign, about the same as during the 2010 election cycle (6% of registered voters). More voters who were contacted by a religious organization were encouraged to vote for Republican candidates (5% of all voters) than for Democratic candidates (less than 1%).[1. A similar question asked in previous Pew Research Center surveys, about being urged to vote by clergy or other religious groups, found the same pattern. In 2000, 2004 and 2008, more Catholics than Protestants report being urged to vote a certain way by clergy or other religious organizations (see https://www.pewresearch.org/politics/2008/11/13/high-marks-for-the-campaign-a-high-bar-for-obama/).


