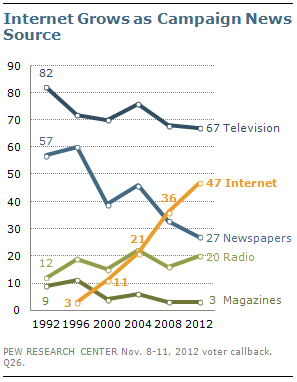
Television remains the leading source for news and information about the presidential campaign, but voters are increasingly turning to the internet for election coverage. Television plays an even more dominant role in election-night coverage: Virtually all voters who followed election returns watched on television. Even among the roughly third of voters who tracked election returns on the internet, most followed on TV as well.
The percentage naming television as a main source of campaign news has changed little from 2008 (68% then, 67% now). In 2004, 76% of voters named television as a main source of election news. Among TV news outlets, 42% cite cable news as a main source. Network television is named by 19% of voters, while 11% cite local TV news. These percentages are little changed from 2008.
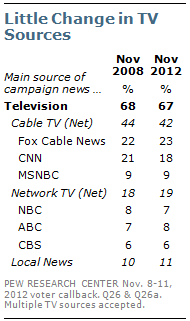
Among cable networks, 23% of voters name the Fox News Channel as a main source; 18% cite CNN and 9% MSNBC. There also is little change in the percentage naming any of these cable networks from 2008.
Since 2008, the percentage using the internet as a main campaign news source has increased 11 points, to 47%, making it the second most frequently used news source by voters. Nearly three-in-ten voters (27%) name newspapers, while 20% cite radio and 3% magazines.
There continue to be large age differences in campaign news sources. More than six-in-ten (64%) voters under 30 name the internet as a main source, while 56% cite television. Even among those 30 to 49, as many cite the internet (65%) as television (60%). However, 74% of voters 50 and older name television as their main campaign news source, while just 31% cite the internet.
Election Night Experience
About eight-in-ten (78%) voters say they followed election returns on the night of Nov. 6. Among
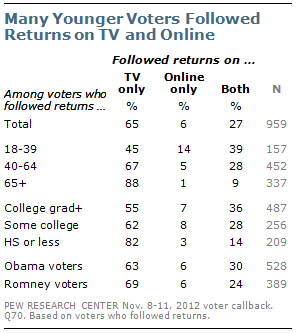
voters who followed election returns, 92% followed them on television, while 34% followed the returns online.
Most voters who tracked the election returns followed them only on television (65%); very few (6%) followed them only on the internet. But 27% “dual-screened” the election returns, following them on television and online over the course of the evening.
About four-in-ten (39%) voters under 40 who followed election returns followed them on TV and the internet. In fact, about as many in this age group followed the returns on TV and online as followed them just on television (45%). Far fewer older voters who followed election returns used both TV and the internet.
College graduates and those with some college experience are far more likely than those with no more than a high school education to say they followed election returns on both TV and the internet (36% and 28% vs.14%).
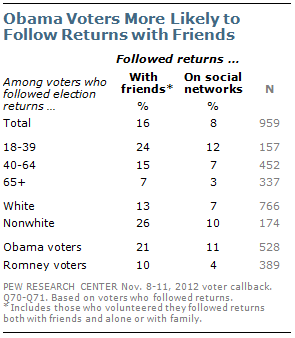
The vast majority of voters who followed the election returns (84%) tracked them by themselves or with their families; 16% followed them with friends, or volunteered that they followed them with friends and alone or with family. By comparison, just 8% followed the returns on Facebook, Twitter or another social network.
Among voters younger than 40 who followed the returns, 24% followed them with friends; that compares with 12% who followed the returns on social networks. Voters 65 and older who tracked the returns were far less likely to follow them with friends (7%) and on social networks (3%).
Obama voters were more likely than Romney voters to follow returns with friends on election night: 21% of those who say they voted for Obama watched the returns with friends, compared with just 10% of Romney supporters. In addition, more Obama voters than Romney voters followed the returns on social networks (11% vs. 4%).
Views of the Press
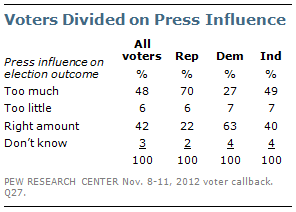
Voters are divided over the press’s impact on the election. About as many say the press had too much influence on the election outcome (48%) as say the press had about the right amount (42%); 6% say the press had too little influence. Fully 70% of Republicans say the press had too much influence. By contrast, 63% of Democrats say the press had the right amount of impact. About half of independents (49%) say the press had too much impact, while 40% say it had the right amount.
Overall, voters think that the press treated each candidate fairly. Six-in-ten (60%) voters say that the press was fair in the way that it covered Obama’s campaign, while 36% say it was unfair; 54% of voters say press coverage of the Romney campaign was fair and 43% say it was unfair.
However, Republicans are far more likely to see unfair treatment of the candidates – 51% of Republicans say Obama’s campaign was covered unfairly while 69% say the press covered Romney’s campaign unfairly.
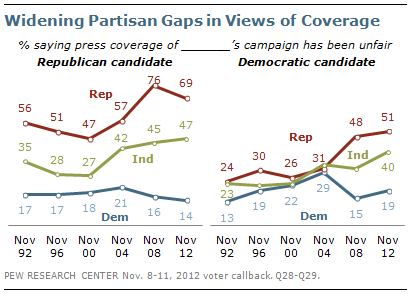
Until 2008, Republicans have generally viewed coverage of the Democratic candidate as fair. But in 2008, 48% said coverage of Obama was unfair; about the same percentage say that today (51%). Republicans have consistently been more likely than Democrats or independents to say that coverage of the GOP candidate is unfair.


