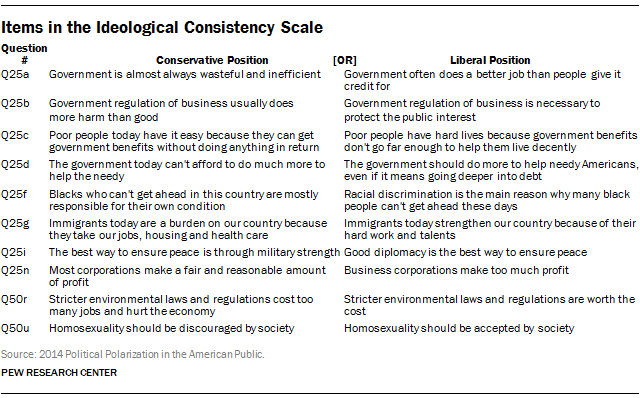
Throughout this report we utilize a scale composed of 10 questions asked on Pew Research Center surveys going back to 1994 to gauge the extent to which people offer mostly liberal or mostly conservative views across a range of political value dimensions. In short, while there is no ex-ante reason for people’s views on diverse issues such as the social safety net, homosexuality and military strength to correlate, these views have a traditional “left/right” association, and the scale measures this growing correlation over time.

The individual questions in the scale are shown here. The topline shows the long term trends on these items, and Section 1 tracks the partisan divides on each question since 1994.
Individual questions were recoded as follows: “-1” for a liberal response, “+1” for a conservative response, “0” for other (don’t know/refused/volunteered) responses. As a result, scores on the full scale range from -10 (liberal responses to all 10 questions) to +10 (conservative responses to all 10 questions). For analytical purposes, respondents are grouped into one of five categories, which are used throughout the report, as follows:
- Consistently conservative (+7 to +10)
- Mostly conservative (+3 to +6)
- Mixed (-2 to +2)
- Mostly liberal (-6 to -3)
- Consistently liberal (-10 to -7)
To put these figures in perspective, a respondent offering five liberal and five conservative views, or six of one and four of the other, would be considered as having “mixed” ideological views. Someone offering seven conservative and three liberal responses, or eight and two, would be considered “mostly conservative.” And any respondents offering nine conservative and one liberal response, or all ten conservative, would be considered “consistently conservative.” Since some people do not answer every question, other combinations are possible.
The graphics in the ideological consistency section and the engagement section use the full set of points on the scale (note that graphics in the ideological consistency section are smoothed by showing the average of two consecutive points on the scale).

Any ideological index has its limitations because defining what it means to be liberal and conservative is inherently controversial. As we have illustrated elsewhere, American political thinking is multidimensional, and any effort to “flatten” ideology to a single left/right dimension may miss this rich texture.
But our purpose here is to study the concept of ideological “consistency” – or the share of Americans who hold liberal or conservative views across a range of values dimensions; this is also sometimes referred to as “ideological constraint” or “ideological sorting” by political scientists and other researchers.
Because the focus is on change over time, we are limited to a set of questions that were invented 20 years ago, and this creates imperfections. For example, the elements of the index do not cover more recent value divides, such as surveillance or terrorism.
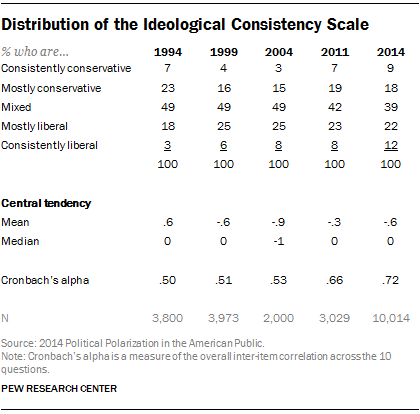
In addition, while the range of the scale (from -10, all liberal responses, to +10, all conservative responses) remains the same throughout the period of study, the “center” of the American public does shift. For instance, in 2014 the mean on the scale is -0.6, slightly to the left; in 1994 the mean score was slightly to the right (+0.6). To a large extent, this shift reflects an overall societal shift to the left on two issues: homosexuality and immigration.
This overall shift does not necessarily mean that the average American is more liberal than conservative because the mean is now less than zero. But it does mean that people on the liberal end of the scale are now somewhat closer to the center of the scale than are those at the conservative end. As a result, the relative sizes of the “consistently liberal” and “consistently conservative” groups are not strictly comparable. That is, because of the scale’s construction, we would not definitively conclude that there are more consistent liberals (12%) than consistent conservatives (9%) today. Yet the changes over time—e.g., the overall increase in the proportion who are consistently liberal or conservative—and the differences in attitudes and behaviors across groups, are robust even when alternative definitions that account for the scaling differences are used.