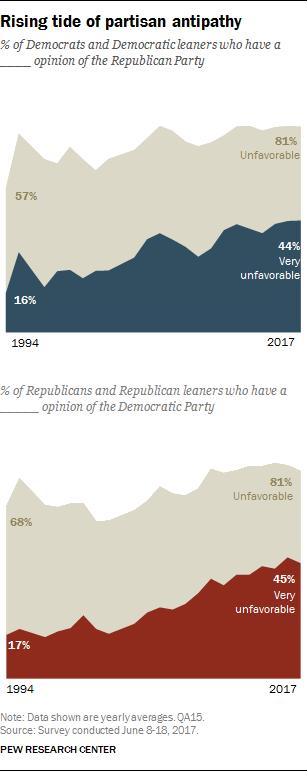
As Republicans and Democrats have moved further apart on political values and issues, there has been an accompanying increase in the level of negative sentiment that they direct toward the opposing party. Partisans have long held unfavorable views of the other party, but negative opinions are now more widely held and intensely felt than in the past.
Among members of both parties, the shares with very unfavorable opinions of the other party have more than doubled since 1994.
In addition, the friend networks of both Republicans and Democrats are dominated by members of their own party and include few members of the other party.
And while opinions of Donald Trump have been deeply polarized along partisan lines since well before he was elected president, the partisan gap in his job approval ratings – based on surveys conducted earlier this year – is larger than for any president in six decades.
More negative views of the opposing party – and its members
As noted in the Center’s 2014 study of political polarization, Republicans and Democrats have long had negative opinions of the other party. But in the past, more partisans had mostly unfavorable views than very unfavorable views.
This is no longer the case. About eight-in-ten Democrats and Democratic-leaning independents (81%) have an unfavorable opinion of the Republican Party, based on an average of surveys conducted this year – with 44% expressing a very unfavorable view. Two decades ago, a smaller majority of Democrats (57%) viewed the GOP unfavorably, and just 16% held a very unfavorable view.
The share of Republicans with highly negative opinions of the Democratic Party has followed a similar trajectory. Currently, 81% of Republicans and Republican leaners have an unfavorable impression of the Democratic Party, with 45% taking a very unfavorable view. In 1994, 68% of Republicans had a negative view of the Democratic Party; just 17% had a very unfavorable opinion.
Last month, a separate Pew Research Center study found that most Republicans and Democrats also had negative views of the members of the opposing party. Majorities in both parties rated each other “coldly” on a 0-100 thermometer scale. Republicans and Democrats rated each other more coldly than they did in December 2016.
Partisans’ close friends tend to be like them politically
Republicans and Democrats both say their friend networks are predominantly made up of people who are like-minded politically.
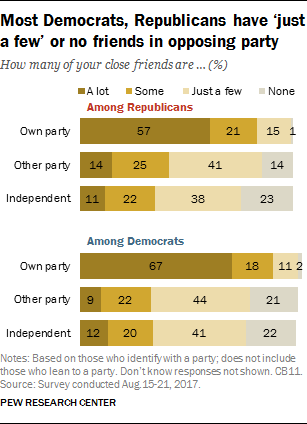
Overall, 57% of those who identify as Republicans say a lot of their close friends are also Republicans, while another 21% say some of them are. An even larger share of Democrats (67%) say a lot of their close friends are Democrats; an additional 18% say some of their close friends are members of their own party.
By contrast, far fewer partisans say they have friends in the opposing party. About four-in-ten Republicans (39%) say they have a lot or some friends who are Democrats; most Republicans (55%) say just a few or none of their friends are Democrats.
Even fewer Democrats (31%) have at least some friends who are Republicans. About two-thirds of Democrats (64%) have just a few or no Republican friends.
Big houses, small houses
Partisan differences extend even to the type of community in which people prefer to live. Most Republicans favor a community that features more space, even if amenities are farther away. Democrats, by contrast, express a preference for a community where houses are smaller and closer together but amenities are nearby.
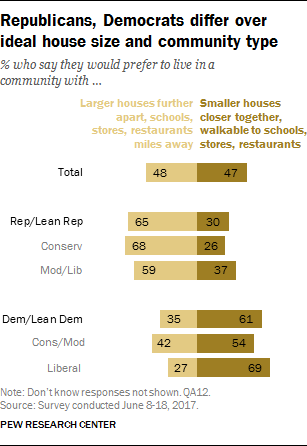
About two-thirds of Republicans and Republican-leaning independents (65%) say they would prefer to live in a community where the houses are larger and farther apart, but where schools, stores and restaurants are several miles away. By contrast, 30% would rather live in a community where the houses are smaller and closer to each other, but schools, stores and restaurants are within walking distances.
Views among Democrats and Democratic-leaning independents are almost the reverse: By 61% to 35%, more say they would prefer a community with smaller houses close to one another that has amenities nearby. Liberal Democrats (69% to 27%) express a preference for this community type by a greater margin than conservative and moderate Democrats (54% to 42%).
Drivers of partisan identity
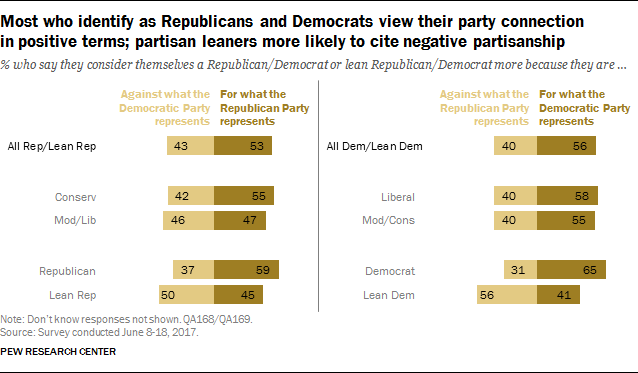
While partisans increasingly express highly negative views of the other political party, most Republicans and Democrats say the reason they affiliate with the political party of their choice is more because they are for what it represents rather than against what the other party stands for.
Overall, 53% of Republicans and Republican leaners say they consider themselves Republicans or lean to the party more because they are for what the GOP represents. Still, about four-in-ten (43%) say it is more because they are against what the Democratic Party represents.
Views among Democrats are similar: 56% of Democrats and Democratic leaners say they consider themselves Democrats or lean to the Democratic Party more because they are for what the party represents, compared with 40% who say it is more because they are against what the Republican Party represents.
However, among both the Republican and Democratic coalitions, those who identify with a party are much more likely than those who lean to a party to say their identity is influenced by support for their own party. By 65% to 31%, Democratic identifiers say they consider themselves Democrats more because they are for what their party represents than against the Republican Party. By contrast, 56% of independents who lean toward the Democratic Party say their affiliation has more to do with being against the Republican Party; 41% say it’s more about being for the Democratic Party. Among those who affiliate with the Republican Party, 59% of identifiers, compared with 45% of leaners, say they affiliate with the GOP more because of what the party represents. (For more on the roots of partisanship, see “Partisanship and Political Animosity in 2016.”)
Republicans and Democrats differ on views of compromise
In general terms, the public continues to express a preference for elected officials who seek political compromises. About six-in-ten (58%) say they like elected officials who make compromises with people with whom they disagree, while fewer (39%) say they like politicians who stick to their positions.
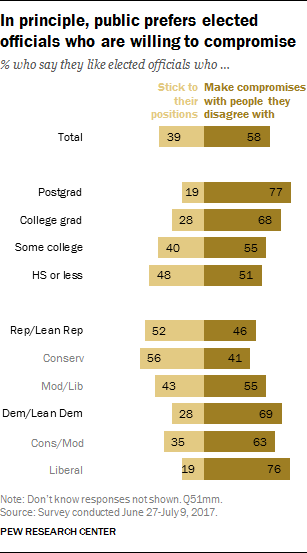
About seven-in-ten Democrats and Democratic leaners (69%) say they like elected officials who compromise. Liberal Democrats (76%) are more likely to hold this view than conservatives and moderates (63%).
Republicans and Republican leaners have much more mixed views: 52% say they like elected officials who stick to their positions, while 46% say they like elected officials who make compromises with people they disagree with. By 56% to 41%, conservative Republicans prefer elected officials who stick to their positions. By contrast, a greater share of moderate and liberal Republicans say they like officials who make compromises (55%) than say they like officials who stick to their positions (43%).
Those with higher levels of education are especially likely to have a positive view of officials who make compromises. Fully 77% of postgraduates say they like elected officials who compromise with people they disagree with, compared with 68% of college graduates, 55% of those with some college experience and 51% of those with no college experience.
While there are mostly positive views of elected officials who make compromises in principle, previous research has shown that liberals and conservatives favor political compromises in which their side gets most of what of it wants to solutions that “split the difference” between their side and the opposition.
Trump’s job ratings in historical context
Presidential job approval ratings have been growing increasingly divided along partisan lines. However, Trump’s first-year job approval ratings are the most polarized of any president dating back to Dwight D. Eisenhower in 1953.

In three surveys conducted in February, April and June, 88% of Republicans, on average, approved of his job performance. By contrast, just 8% of Democrats approved.
The historic partisan gap in Trump’s job ratings is in large part because of his unusually low ratings among Democrats. Trump has the lowest approval marks from the opposing party of any president in the past six decades.
Even before Trump took office, there had been a downward trend in presidential approval ratings among members of the party not in control of the White House. The previous lows were during the presidencies of Bill Clinton, whose average rating among Republicans was just 22% during his first year in office, and Barack Obama (23%). George W. Bush was an exception to this trend in his first year (46% average job rating among Democrats), largely because of his extraordinarily high level of support after the 9/11 attacks. Across his two terms, Bush’s average rating among Democrats was just 23%, the lowest of any president among members of the opposition party except Obama (14%).
Trump’s first-year job ratings among members of his own party have been on par with many recent presidents, including Obama and Bush. Among presidents since Eisenhower, Clinton (72%), Jimmy Carter (also 72%) and Gerald Ford (66%) were the only ones to receive job ratings below 80% from members of their own party during their first years in office.
Trump’s impact on the Republican Party
The public has mixed views on Trump’s impact on the Republican Party. Overall, 39% say Trump has changed the Republican Party for the worse, while about as many (38%) say he hasn’t changed the party much; just 20% say he has changed the GOP for the better.
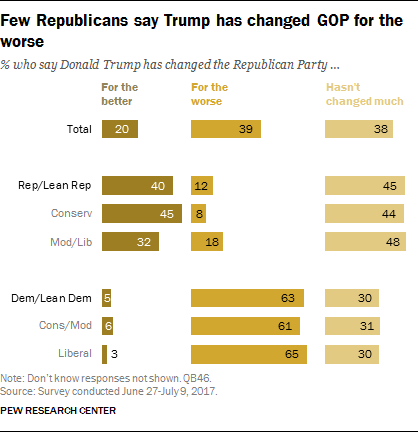
Among Republicans and Republican leaners, 45% say he hasn’t changed the party much, while 40% say he has changed it for the better. Few Republicans (12%) say he has changed the party for the worse. Conservative Republicans (45%) are more likely than moderate and liberal Republicans (32%) to say Trump has changed the party for the better.
Democrats have a highly negative view of Trump’s impact on the GOP. Overall, 63% of Democrats and Democratic leaners say Trump has changed the Republican Party for the worse; 30% say he hasn’t changed the party much, and just 5% say he has changed it for the better. There is little difference between the views of liberal Democrats and conservative and moderate Democrats on this question.
Correction: The labels at the top of the chart “Wider partisan gap on Trump job rating than for any president in six decades” have been updated to exclude independents who lean Democratic or Republican. The numbers have not changed.