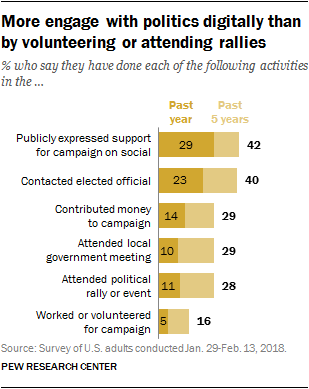
Many Americans participate in politics, either by volunteering for or donating to campaigns, attending protests or meetings, contacting officials or expressing their views on social media. Overall, a large majority (67%) reports having engaged in at least one of these activities in the past five years; nearly half (46%) say they have done so in the past year alone.
About four-in-ten Americans (42%) say they have publicly expressed support for a political campaign on social media in the past five years, and 29% say they have done this in the past year.
Nearly as many (40%) say they have contacted an elected official in the past five years, while 23% have done so in the past year. Smaller shares – slightly less than a third – report making donations to campaigns (29%), attending local government meetings (29%) or attending political rallies or events (28%) in the past five years. And 16% say they have worked or volunteered for a political campaign in the past five years (5% in the past year).
Demographic and educational differences in political engagement
Overall, older, more educated and more ideological Americans tend to report having engaged in more forms of political activism than younger, less educated and less ideological adults. But there are some notable exceptions to these patterns.
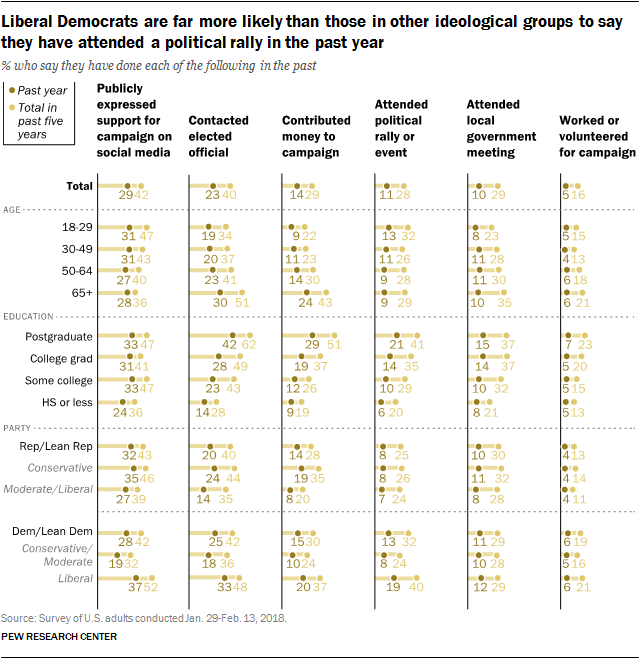
Contacting political officials and donating to political campaigns are activities that are dominated by older and better educated people. About four-in-ten of those with at least a four-year college degree (43%) say they have contributed money to a political candidate or a group working to elect a candidate in the past five years, about double the share of those who have not completed college (22%). The gap in political donations is about as wide between adults 65 and older and those younger than 30.
By contrast, young adults are more likely than the oldest adults to have attended a political rally, speech or campaign event. Those under 30 are also about as likely as older adults to have publicly expressed support for a political campaign on social media in the last year (and more likely to have done so in the last five years). While those who have never attended college are less active politically on social media than those who have attended college, the differences on this measure of engagement are fairly modest.
Overall, Democrats and Democratic-leaning independents are about as likely to engage in most political activities as Republicans and Republican leaners. But in some cases, such as donating to campaigns and contacting elected officials, the parties are divided along ideological lines. Liberal Democrats are more likely than conservative and moderate Democrats to engage in both activities; similarly, conservative Republicans are more likely than moderate and liberal Republicans to give money to candidates and contact elected officials.
And liberal Democrats stand out from other ideological groups in their attendance at political rallies or events. About one-in-five liberal Democrats (19%) say they have attended a political rally, event or speech in the past year, more than double the shares of conservative and moderate Democrats (8%), conservative Republicans (8%) or moderate and liberal Republicans (7%).
Campaign contributions: Most are less than $250
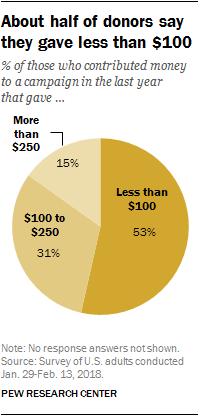
Most who report contributing money to a candidate or campaign in the past year say their contributions added up to less than $250. About half (53%) say they gave less than $100 and 31% say they gave $100 to $250. Only 15% say they gave more than $250.
Republicans and Democrats who have made donations report contributing similar amounts: 53% of Republicans and Republican leaners and 55% of Democrats and Democratic leaners say they gave less than $100.
People with higher incomes who donate to political campaigns are more likely to say they gave in greater amounts than those with lower incomes. More than a quarter (27%) of those with family incomes of more than $100,000 who have made a political contribution in the past year have donated more than $250, which is a much larger share than contributors in lower income categories.
About half of Americans talk about politics at least weekly
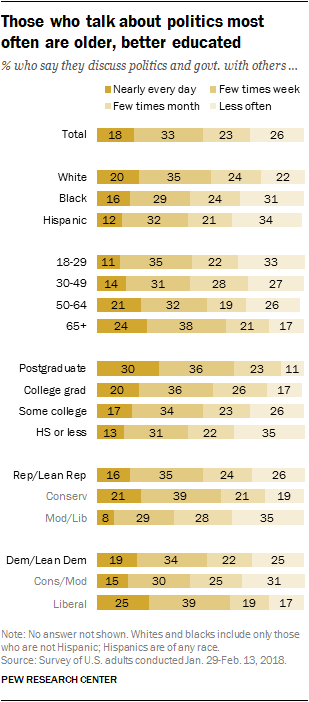
About half of the public (51%) say they discuss politics with others at least a few times a week, including 18% who say they have discussions touching on politics nearly every day. A third say they have them a few times a week. Those who talk politics less regularly are about evenly split between having these discussions a few times a month (23%) or less often (26%).
As with many forms of political participation and activism, those who talk about politics more frequently are older and better educated.
Nearly two-thirds of those older than 65 (63%) say they have these discussions at least weekly, and slightly more than half of those ages 50 to 64 say the same (54%). Just 45% of those 18 to 29 and 30 to 49 say they talk about politics with others at least weekly.
More educated Americans report talking about politics more as well. Two-thirds of those who have a postgraduate degree (66%) say they talk politics at least weekly, as do nearly six-in-ten college graduates (57%). Those with some college experience talk less about politics (51%) than those holding a college degree, but they are more likely than those with a high school degree or less (43%) to have weekly conversations on politics.
Similar shares of Republicans and Republican leaners (51%) and Democrats and Democratic leaners (53%) report discussing politics with others at least weekly. Conservative Republicans and liberal Democrats talk about politics more regularly than others within their parties. Six-in-ten conservative Republicans say they talk politics at least a few times a week, compared with 37% of moderate and liberal Republicans. Overall, 63% of liberal Democrats also say they discuss politics at least weekly; 45% of conservative and moderate Democrats say the same.
Most voters say partisan control of Congress ‘really matters’
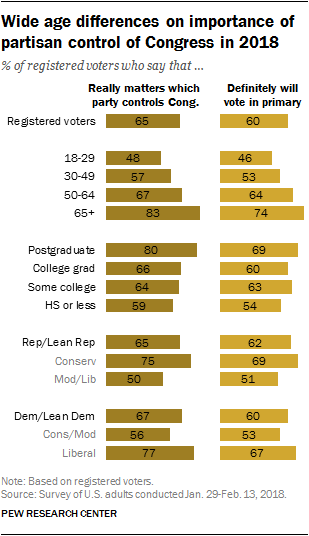
With months to go before the 2018 midterm election, most voters say it “really matters” which party wins control of Congress. Given a four-point scale on the importance of partisan control of Congress, a majority of registered voters (65%) place themselves at the top of the scale – meaning it really matters to them which party gains control.
There are substantial age differences in these opinions. More than eight-in-ten voters 65 and older (83%) say partisan control really matters as do 67% of those 50 to 64. That compares with 57% of those 30 to 49 and only about half (48%) of registered voters under 30.
An overwhelming majority of voters with postgraduate degrees (80%) say control of Congress really matters, compared with 66% of those with a college degree, 64% of those with some college experience and 59% of those with no more than a high school education.
Republicans (65%) and Democrats (67%) are about equally likely to say that it really matters who controls Congress. Three-quarters of conservative Republicans say this compared to half of moderate and liberal Republicans. Similarly, 77% of liberal Democrats say it really matters versus 56% of conservatives and moderates in the party.
There are similar patterns when it comes to the share of registered voters who say they will definitely vote in the primary elections for Congress this year. Older voters are more likely than younger voters to say they will definitely cast a ballot in the primaries. Voters with no more than a high school education are much less likely than those with at least some college experience to say they will definitely vote. And conservative Republicans (69%) and liberal Democrats (67%) are more committed to voting in the primaries than moderate and liberal Republicans (51%) and conservative and moderate Democrats (53%).
The public’s civic and political knowledge
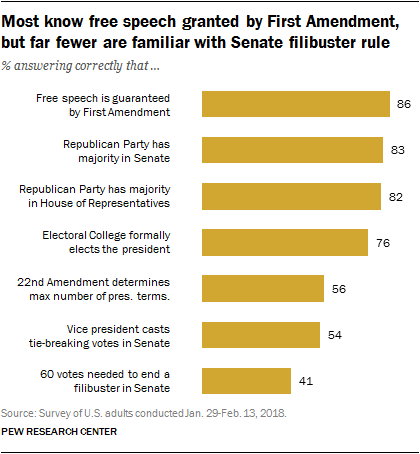
Public knowledge on civic and political questions varies widely by issue. Large majorities are familiar with the First Amendment and the role of the Electoral College, but the public struggles when asked about other topics such as the filibuster and tie-breaking procedures in the Senate. (Take the civics knowledge quiz.)
A majority of Americans (86%) correctly identify free speech as a right guaranteed by the First Amendment. On another constitutional question, about three-quarters (76%) of the public are able to identify the Electoral College as the assembly that formally elects the president.
When it comes to two questions about the current political dynamics in Washington, 83% know that the Republican Party holds a majority in the Senate and about the same share (82%) knows that the GOP also controls the House of Representatives. When taken together, 75% of the public can correctly name the majority party in both the House and Senate.
The public does less well on other questions about the structure of American government. Overall, 56% know that the number of terms a president can serve is determined by the 22nd Amendment; 54% can correctly identify the vice president as the person who casts the tie-breaking vote in a deadlocked Senate.
Fewer than half (41%) are aware that 60 votes are needed to end a filibuster in the U.S. Senate, the lowest level of public knowledge on any of the seven questions included in the survey
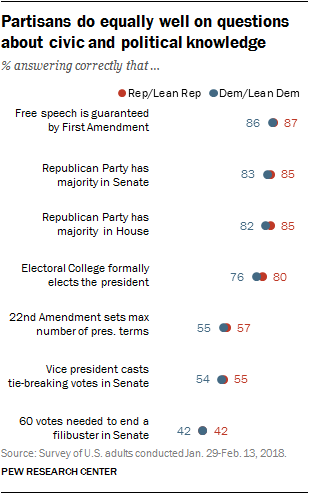
Republicans and Democrats perform about equally well on the civic and political knowledge questions included in the survey. For example, nearly identical shares of Republicans and Republican leaners (87%) and Democrats and Democratic leaners (86%) know that the First Amendment guarantees the right to free speech.
There are no significant divides between Republicans and Democrats on most questions and 4 percentage points is the most that separates the two groups on any single item (80% of Republicans can correctly identify the Electoral College, compared with 76% of Democrats).
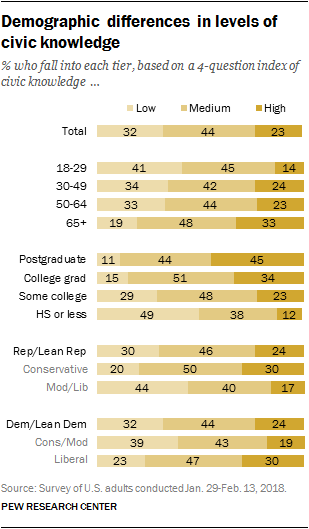
A three-point index based on responses to questions about the Electoral College, filibuster, Senate tie-break procedure and presidential term limits shows overarching demographic patterns in civic knowledge. Overall, 23% of the public scores high on this scale of civic knowledge, while 44% have a medium level of knowledge and 32% have a low level.
There are clear demographic differences in civic knowledge with older and better educated adults performing better than younger and less-well educated adults.
Among those 65 and older, 33% have high levels of civic knowledge, while another 48% have medium levels. Civic knowledge is lower among younger adults and it is particularly low among those ages 18 to 29, just 14% of whom score high on the index.
Civic knowledge varies across levels of education: 45% of those with a postgraduate degree have a high level of civic knowledge compared with 34% of college graduates, 23% of those with some college experience and just 12% of those with no college experience. Nearly half (49%) of those with no college experience score low on the index of civic knowledge.
While there are no major differences between Republicans and Democrats in responses, there are significant divides by ideology within both parties. Conservative Republicans are more likely than moderate and liberal Republicans to score high on the index (30% vs. 17%). Among Democrats, liberals are more likely to be in the top tier of civic knowledge than moderates and conservatives (30% vs. 19%).