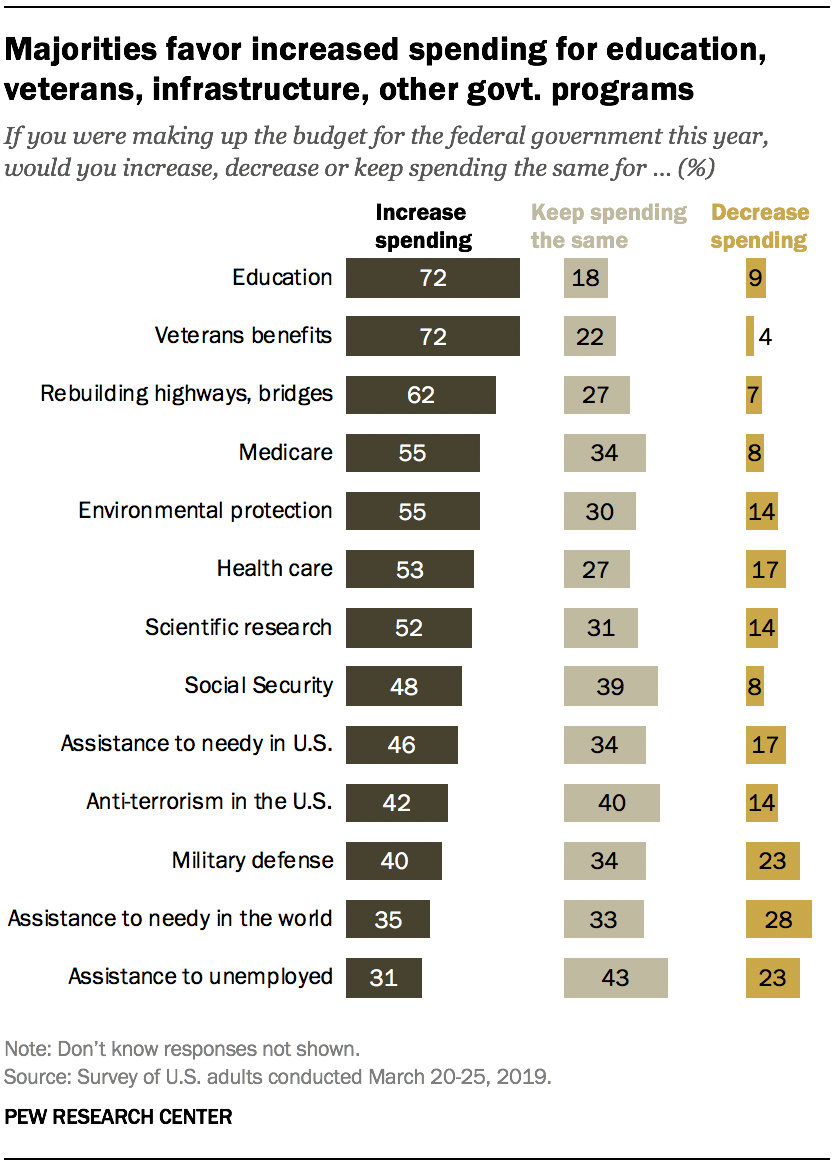
When Americans are asked to make up the budget for the federal government, they have little appetite for austerity measures. Asked about 13 different government program areas, from veterans benefits to foreign aid, no more than about a quarter favor reducing spending in any specific area.
The survey by Pew Research Center, conducted March 20-25 among 1,503 adults, finds that across all 13 programs, most either want to increase spending or maintain it at current levels.
As in the past, there is extensive public support for increasing federal funding for veterans benefits and education (72% each). About six-in-ten (62%) support more government spending for rebuilding the nation’s highways, bridges and roads, while 55% each favor more funding for Medicare and environmental protection.
By comparison, only about a third favor increased funding for aid to needy people around the world (35%) and assistance to the unemployed in the United States (31%). But for both programs, somewhat fewer want to cut spending than increase it (28% favor decreased spending on foreign aid, 23% on aid to the unemployed).
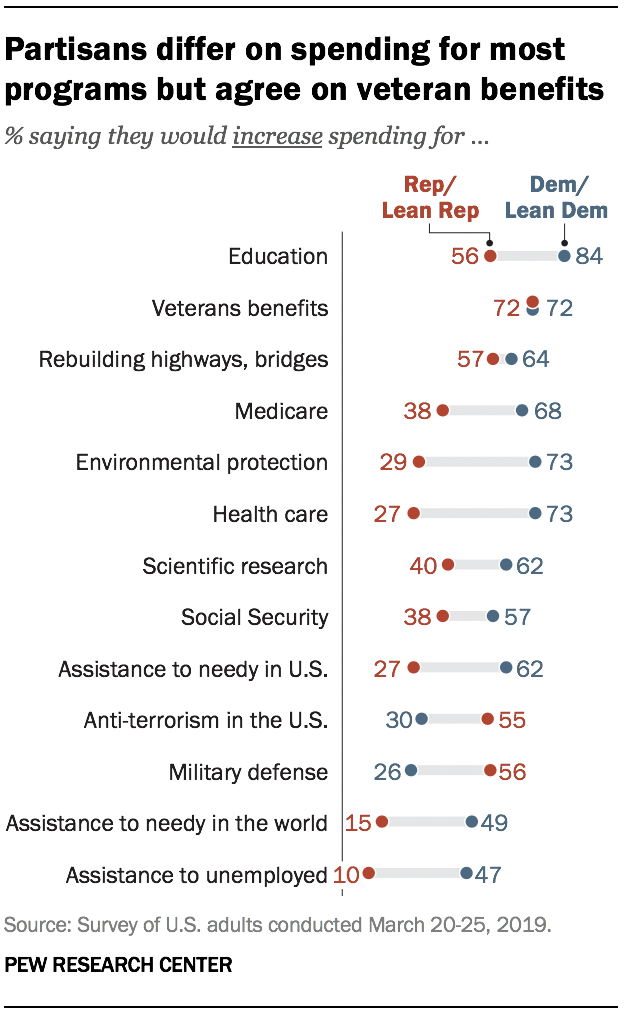
In most cases, the public’s views on government spending have changed little since 2017, but there is considerably more support for increased spending in several areas now than in 2013. Over the past six years, public concern about the budget deficit also has declined substantially.
Republicans and Democrats continue to have deep differences over increased government spending in most areas, including health care, environmental protection, aid to the unemployed and military defense.
Yet veterans benefits and infrastructure continue to stand out as areas in which partisans generally agree. Identical shares in both parties (72% of Republicans and Democrats) say spending on veterans benefits should be increased. And 64% of Democrats favor more government spending on rebuilding highways, bridges and roads, while a majority of Republicans (57%) also support this.
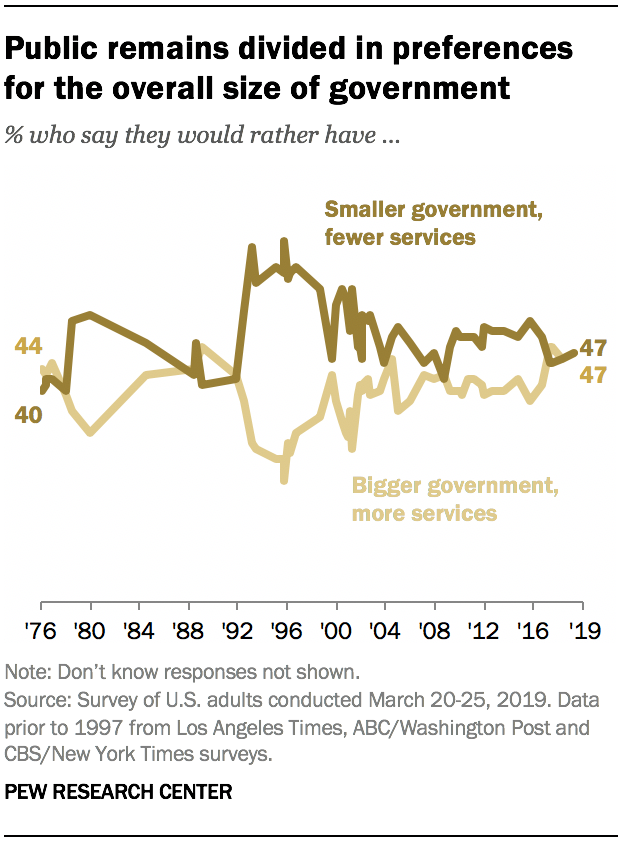
While Americans support increased government spending in a number of areas, they continue to be divided in preferences regarding the overall size of government: 47% say they would rather have a smaller government with fewer services, while an identical share prefers a bigger government with more services. These views have changed little since 2017, but for several years prior to that, more Americans preferred smaller government to bigger government.
Opinions about the optimal size of government continue to be deeply divided along partisan lines: 74% of Republicans and Republican-leaning independents prefer a smaller government with fewer services, while 67% of Democrats and Democratic leaners say they would rather have a bigger government with more services.
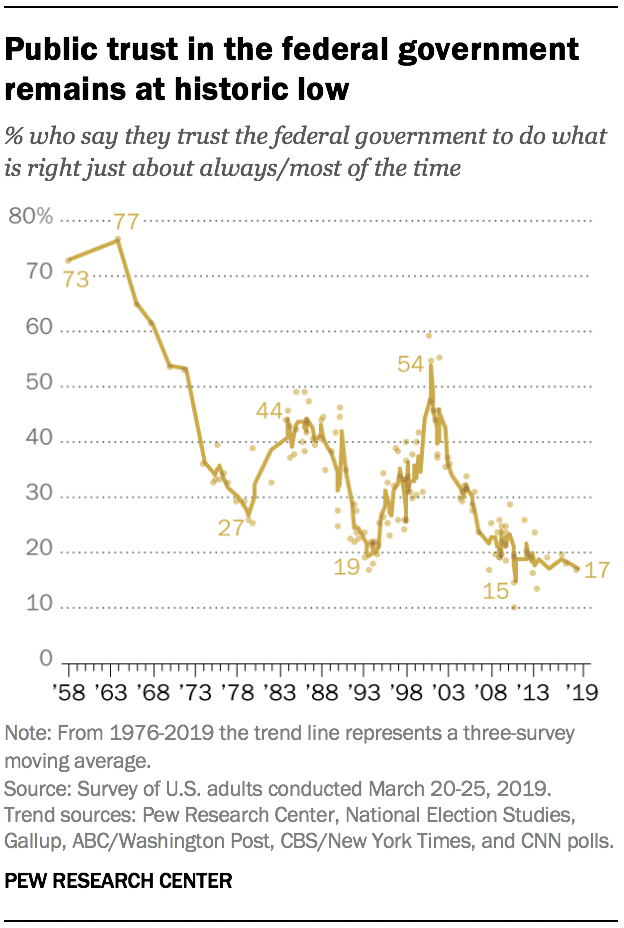
The survey finds that Americans’ trust in the federal government remains at a historic low: Just 17% say they trust the government in Washington to do the right thing always or most of the time; 71% say they trust the government only some of the time and 10% volunteer that they “never” trust the government.
These attitudes have changed little over the last two administrations. In fact, it has been more than a decade, during George W. Bush’s second term, since as many as a third of Americans said they trusted the federal government at least most of the time. And with the exception of a brief period following the 9/11 terrorist attacks, it has been more than 40 years since public trust in government surpassed 50%.
As in the past, trust in government is higher among the party that controls the White House than among members of the opposition party. However, only 21% of Republicans say they trust the federal government, which is about as low as at any point during Bush’s presidency (the previous GOP administration). Just 14% of Democrats say the same, among the lowest levels dating back more than 60 years.
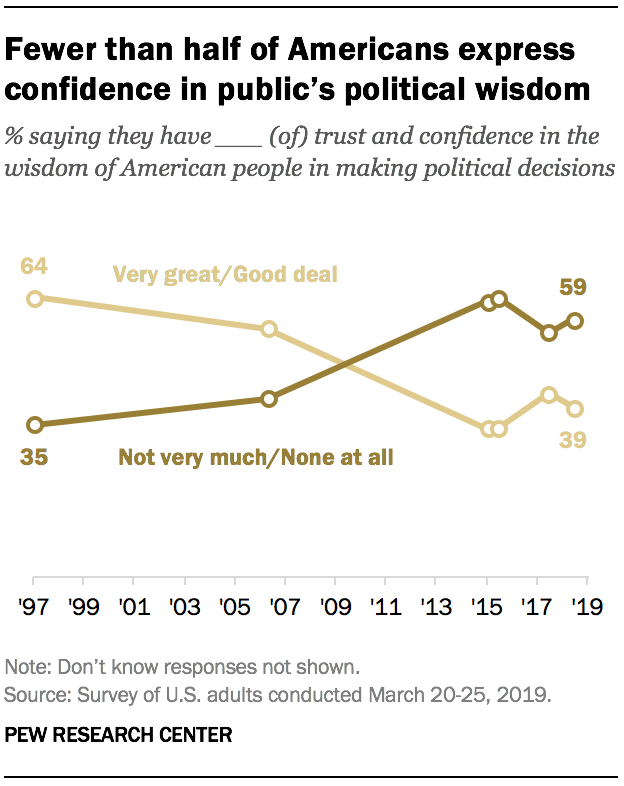
While Americans have minimal trust in the federal government, they also are skeptical of their own collective political wisdom. About four-in-ten (39%) say they have a very great deal (7%) or good deal (31%) of trust and confidence in the wisdom of the American people when it comes to making political decisions. A 59% majority says they have not very much confidence (47%) or no confidence at all (12%) in the public’s political wisdom.
Republicans are somewhat more likely than Democrats to have at least some confidence in the wisdom of the American people. But the share of Republicans expressing at least a good deal of confidence in the public’s wisdom has declined 11 percentage points from a year ago, before the GOP’s losses in the midterm election.
Little change in views of government spending since 2017, but major shifts since 2013
Public attitudes about whether government spending should be increased, decreased or maintained are little changed since 2017 for most of the 13 program areas asked about in the survey. However, there is significantly more support for increased spending in all 13 areas today than there was in 2013.
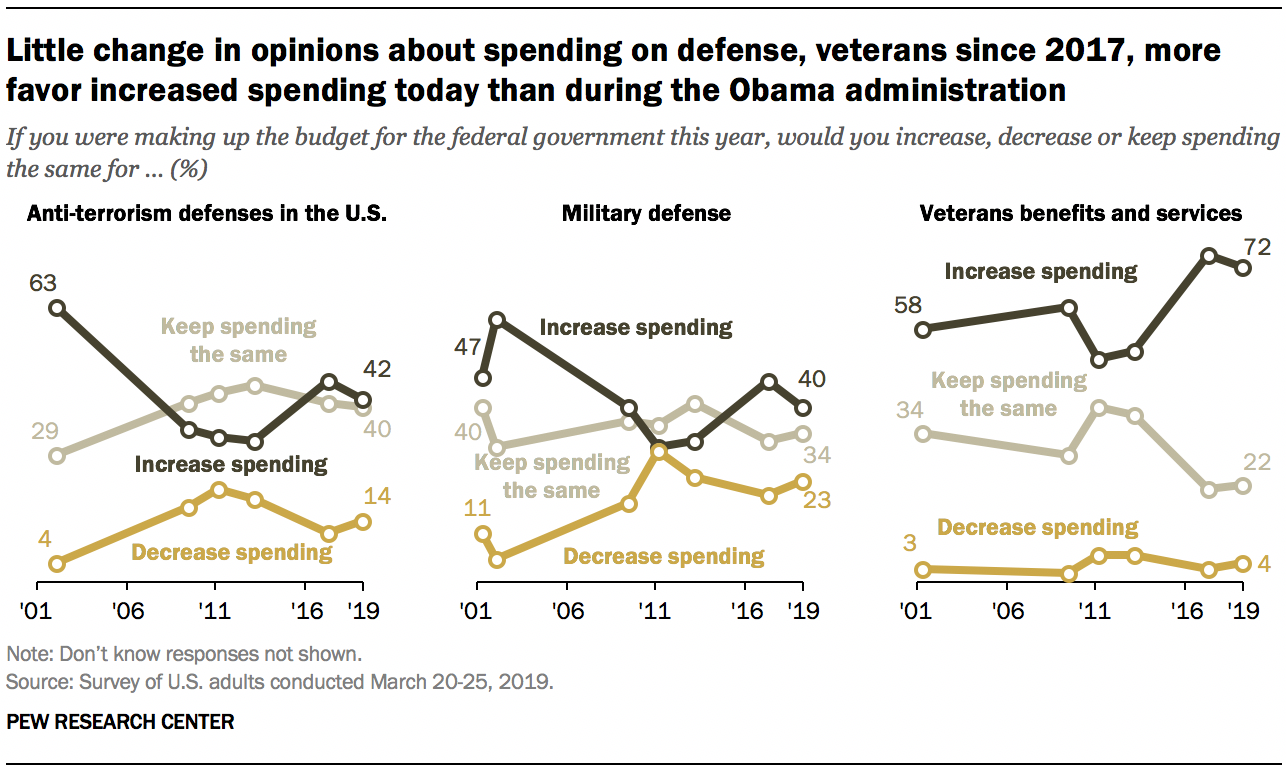
Roughly four-in-ten Americans (42%) say they would increase federal spending for anti-terrorism defenses in the U.S., about the same as in 2017. But in 2013, only about a third (32%) favored increased spending for anti-terrorism defense. In early 2002, a few months after the 9/11 terrorist attacks, a majority (63%) supported increased spending for terrorism defenses.
The share of Americans who favor increased spending on military defense, which rose in 2017, has slipped 6 percentage points since then (from 46% to 40%). Most of the decline has come among Republicans; 56% favor higher defense spending today, compared with 71% who did so two years ago. However, the share of Republicans who support cutting defense spending remains low (10%).
More Republicans support maintaining the status quo in defense spending today than in 2017 (34% now, 20% then).
Just 26% of Democrats favor increased spending for military defense, little changed since 2017. About three-in-ten Democrats (31%) support decreased defense spending, nearly three times the share of Republicans who say this.
Increased government spending for veterans’ benefits continues to draw broad bipartisan public support. About seven-in-ten Americans (72%) – and identical shares in both parties (72% each) –say spending should be increased. Two years ago, a similar share (75%) said this, though significantly fewer Americans (53%) supported increased spending for veterans benefits in 2013.
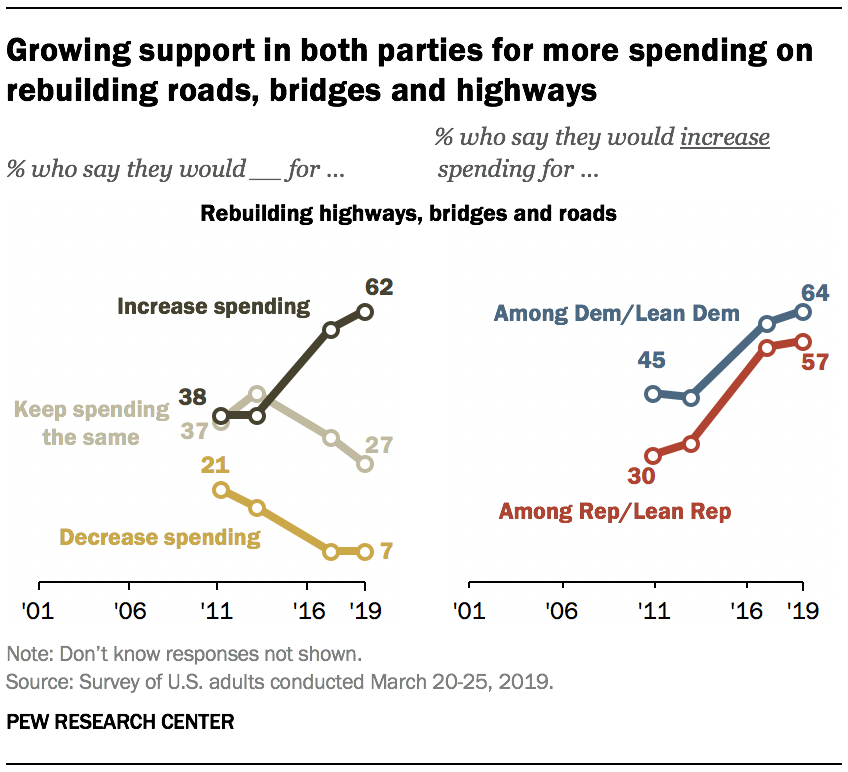
As is the case with veterans benefits, increased spending for infrastructure is supported by majorities in both parties. Since 2013, the share of Republicans who favor higher spending for rebuilding roads, bridges and highways has increased 24 percentage points (from 33% to 57%), and there has been a comparable increase among Democrats (from 44% to 64%).
Widening partisan gap in views of spending on foreign aid
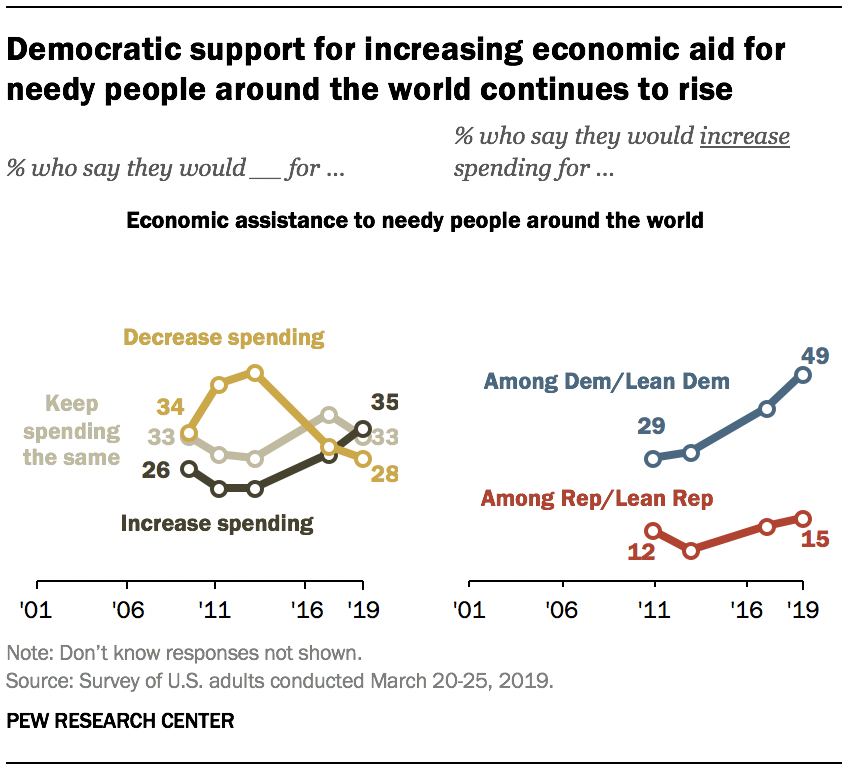
As was the case in 2017, the public is divided in opinions about whether economic assistance for needy people around the world should be increased (35%), maintained at its current level (33%) or decreased (28%).
Since 2013, however, the share of Americans who favor increased spending for needy people overseas has risen 14 percentage points (from 21% to 35%), while the share who support decreased spending has declined 20 points (from 48% to 28%).
About half of Democrats (49%) say economic aid to needy people around the world should be increased, up modestly from 41% in 2017. Six years ago, just 30% said spending should be increased.
Republicans are much less supportive of increased economic assistance to the needy around the world – just 15% say spending should be increased, and this number has not changed much since 2009.
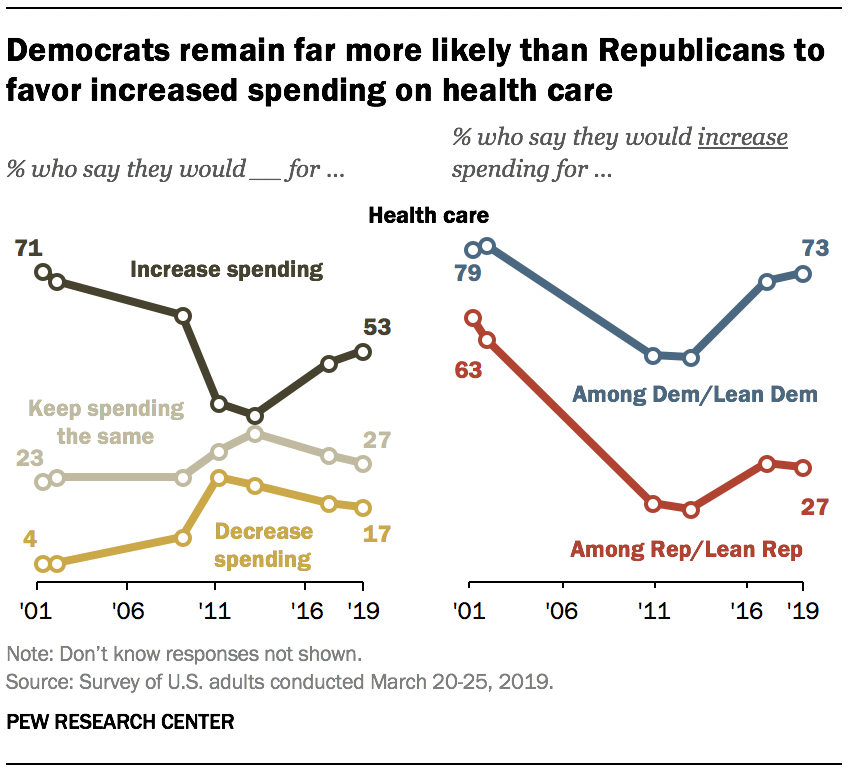
Support for increased spending on health care is much higher than it was in 2013, but not as high as it was in the early 2000s. Today, about half (53%) say they would increase spending on healthcare. In 2013, about four-in-ten (38%) said this. But in 2001, fully seven-in-ten Americans (71%) said spending for health care should be increased.
Democrats continue to be much more likely to say spending should be increased than Republicans – about seven-in-ten Democrats (73%) say this, compared with just 27% of Republicans. The numbers saying this in both parties are largely unchanged since 2017, though both parties are more likely to say this than they were six years ago.
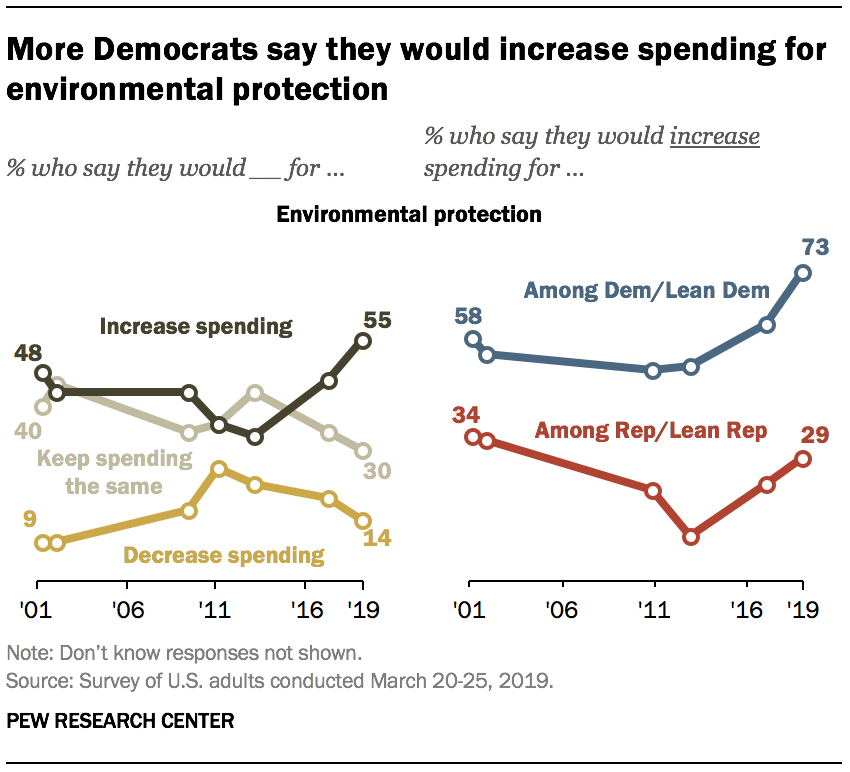
More than half of the public (55%) say they would increase spending on environmental protection if they were making up the budget for the federal government this year. This is larger than the 46% who said this in 2017 and much larger than the one-third of Americans who said they would increase spending in 2013.
The share of Democrats saying they would increase spending on environmental protection has risen steadily since 2011. And the nearly three-quarters (73%) who say they would increase spending today is 12-percentage points higher than it was two years ago.
Republican views are little different than they were in 2017. However, GOP support for increasing spending for environmental protection is significantly higher than it was in 2013 (29% say this now, compared with 11% then).
Views of size and scope of government
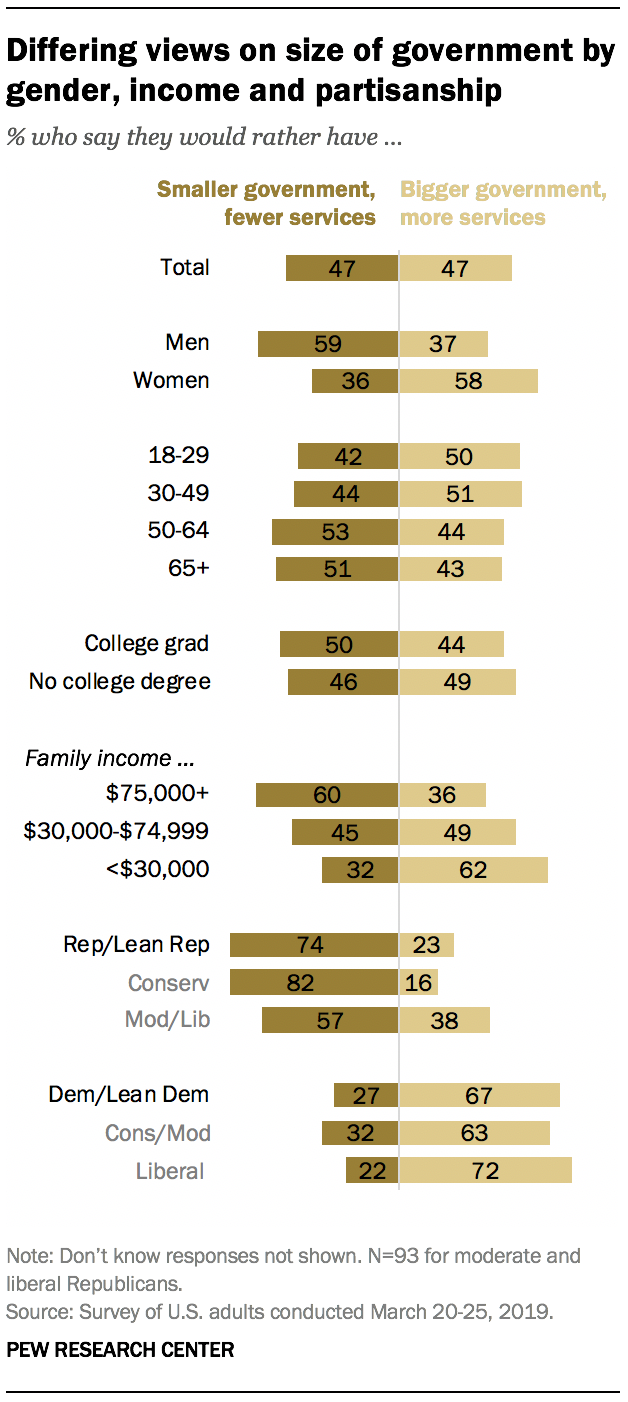
The public is split in their general preferences on the size and scope of government: 47% say they would rather have a smaller government providing fewer services while an identical share say they would prefer a bigger government providing more services.
There are sizable differences in these attitudes by gender, income and partisanship.
While more men prefer a smaller government to a bigger government (59% to 37%), the balance of opinion is reverse among women; 58% prefer a larger government, while 36% say they would rather have a smaller government.
A majority of those with family incomes of $75,000 or more (60%) say they would rather have smaller government with fewer services. In contrast, most of those with incomes of less than $30,000 (62%) prefer a bigger government providing more services. Views are about evenly divided among those with incomes between $30,000 and $75,000.
Adults ages 50 and older are slightly more likely than those younger than 50 to prefer smaller government – though views are relatively divided among adults across age groups.
There continue to be large partisan differences in views of the size of government. Nearly three-quarters of Republicans and Republican-leaning independents (74%) say they prefer a smaller government with fewer services. Conservative Republicans are more likely than moderate or liberal Republicans to express this preference (82% to 57%).
In contrast, Democrats are more likely to say they prefer a bigger government with more services (67%) to a smaller government providing fewer services (27%). There are no significant ideological differences among Democrats.
Public trust in the federal government remains low
As has been the case for more than a decade, the public’s trust in the federal government to do what is right remains historically low. Today, just 17% of adults say they trust the federal government to do what is right “just about always” (3%) or “most of the time” (14%). A large majority (71%) says they trust the government “only some of the time”; 10% volunteer that they never trust the federal government.
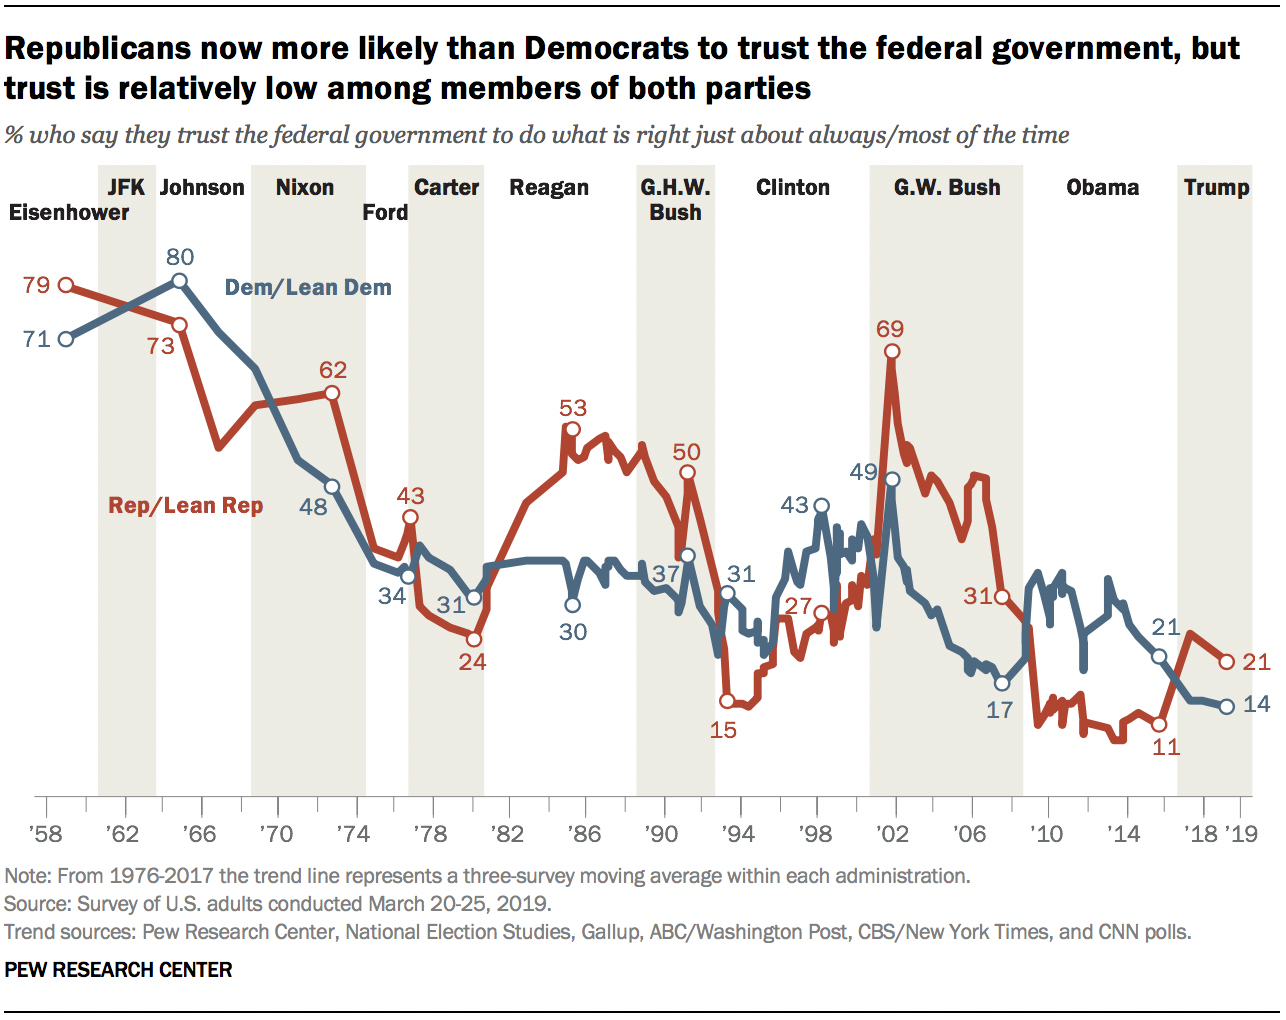
Just 21% of Republicans say they trust the federal government at least most of the time. Trust in government among Republicans is significantly higher than it was during Barack Obama’s tenure as president, having risen after the 2016 election of Donald Trump. Still, the share of Republicans expressing trust in government remains lower than it was during most of George W. Bush’s years as president.
Democrats are even less likely than Republicans to say they trust the federal government: Only 14% of Democrats and Democratic-leaning independents say they trust government most of the time or just about always. This is much lower than the share who said this during Obama’s presidency, and among the lowest levels recorded among Democrats since the question was first asked 60 years ago.
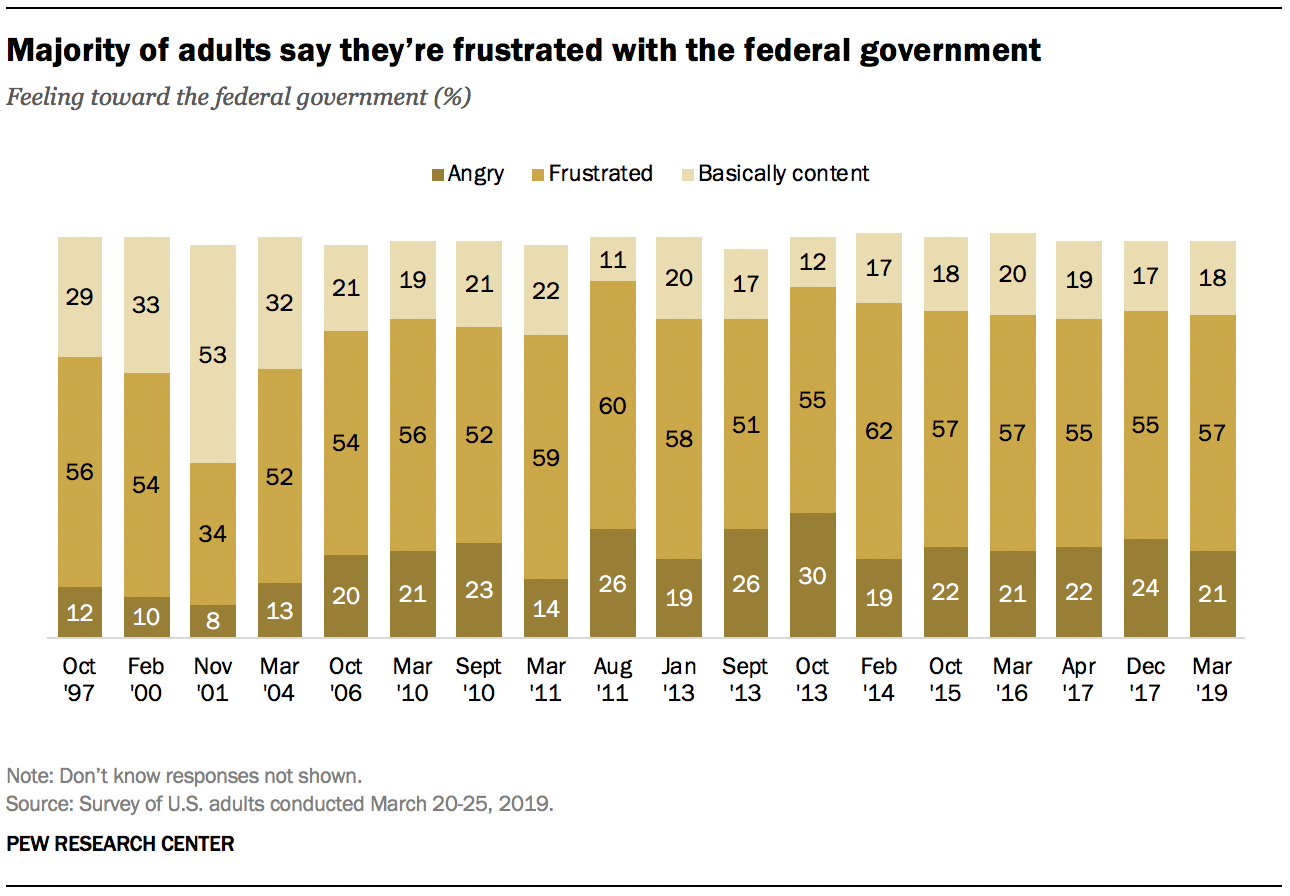
When asked about their feelings toward the federal government, a majority (57%) say they are frustrated, while 21% say they are angry and 18% say they are basically content.
Overall, the public’s feelings toward the federal government are roughly the same as those expressed throughout much of Obama’s presidency. The current level of anger toward the federal government is similar to levels seen over the last few years, though lower than it was in October 2013, during a two-week government shutdown.
Since Trump has taken office, Democrats have been more likely than Republicans to say they feel angry toward the federal government. Today, a quarter of Democrats (25%) say this compared with 18% of Republicans.
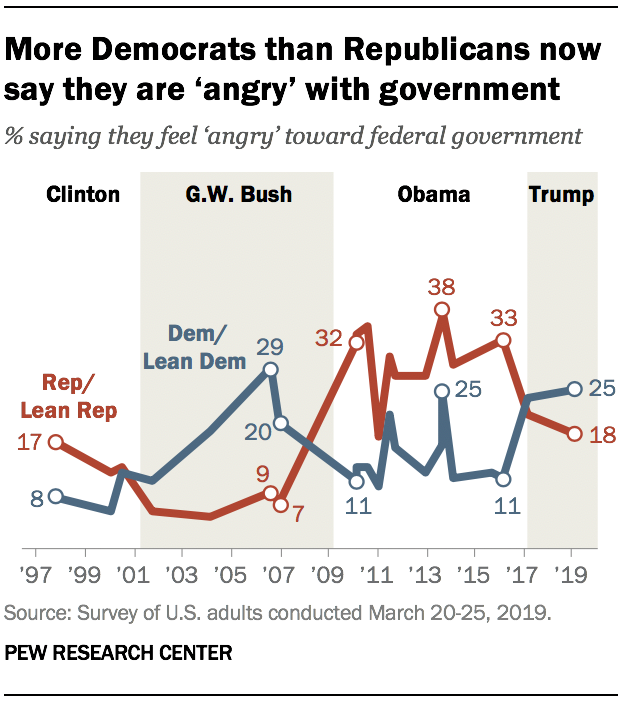
Levels of anger toward the federal government have fallen significantly among Republicans since the end of Obama’s administration. In early 2016, a third of Republicans and Republican-leaning independents (33%) said they felt angry toward the federal government. Today, fewer Republicans express anger at the federal government (18%). Most say they feel frustrated (55%), while 24% say they are content.
Over the same period, Democrats have grown more likely to say they are angry. In 2016, 11% of Democrats and Democratic leaners said they felt this way toward the federal government. Today, more than twice as many Democrats say they feel angry (25%). Still, frustration remains the predominant feeling toward government among Democrats: 59% say they feel this way; just 14% say they are basically content.
Most lack confidence in public’s political wisdom
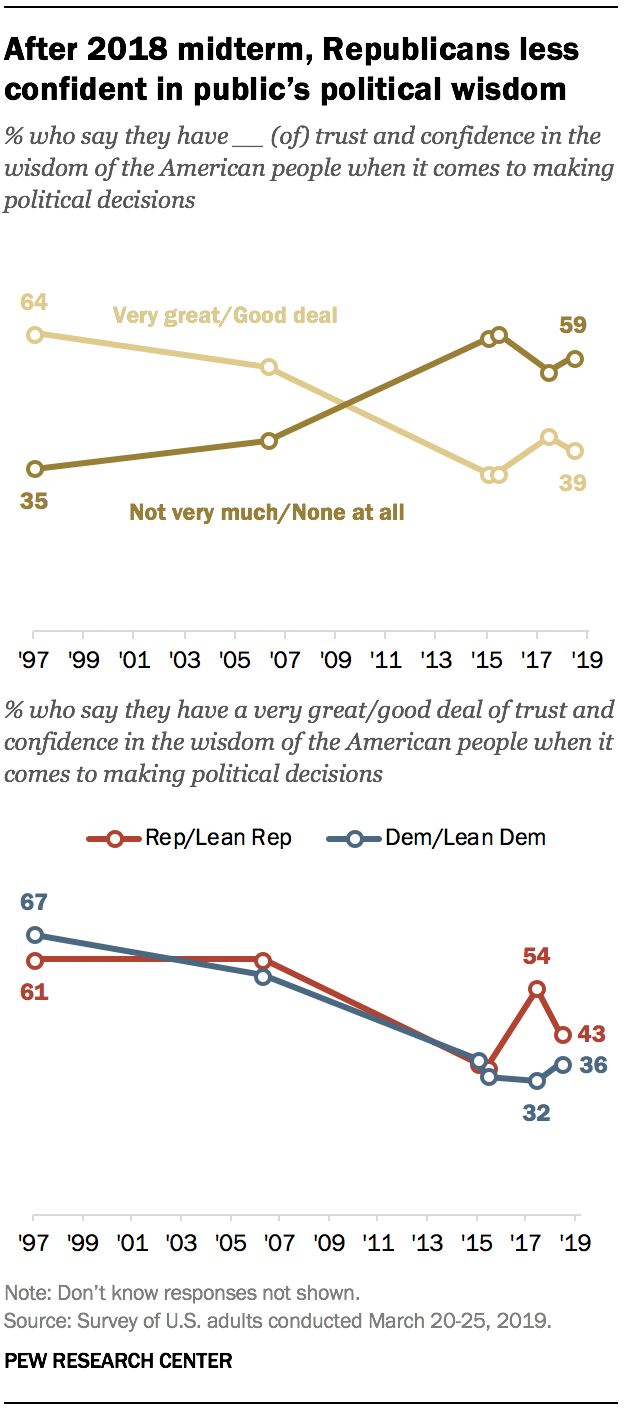
A majority of adults say they have little or no confidence in the wisdom of the American people when it comes to making political decisions (59%). Fewer say they have a very great deal or good deal of confidence (39%).
Among the general public, views regarding the political wisdom of the American people are largely unchanged over the past year.
Republicans, however, have become less likely to express trust and confidence in the wisdom of the American people when it comes to political decisions. In March 2018, prior to the Democratic Party winning control of the House of Representatives, a narrow majority of Republicans said they have a very great or good deal of confidence (54%). Today, fewer than half (43%) of Republicans express confidence.
During that same period, Democrats’ views have remained mostly unchanged. A year ago, 32% of Democrats expressed confidence in the political wisdom of the American people. Today, 36% say this. Most Democrats continue to say they have not very much (50%) or no confidence at all (11%) in the political wisdom of the American people.


