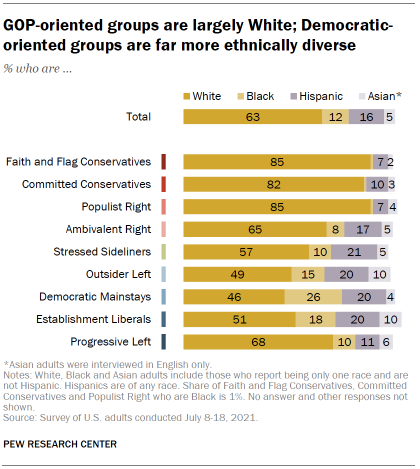
As the United States has grown more demographically diverse, the differences in the racial and ethnic composition of the Republican and Democratic coalitions have widened. These differences are clearly evident in the political typology.
While White adults constitute the majority in all four Republican-oriented groups, they make up a majority in only one of the four Democratic-oriented groups – Progressive Left (68% non-Hispanic White).
Democratic Mainstays have the largest share of Black adults among the nine typology groups (26%), with the next two largest shares among Establishment Liberals (18%) and Outsider Left (15%). The share of Black adults in each of the remaining groups is around 10%, except for the three most conservative groups: Black adults make up 1% or fewer of Faith and Flag Conservatives, Committed Conservatives and Populist Right.
Hispanics constitute about 20% of three of the four Democratic-oriented groups (all except Progressive Left), as well as 21% of Stressed Sideliners and 17% of Ambivalent Right. Hispanics make up smaller shares (roughly 10% or less) of the three most conservative typology groups. While Asian adults make up about 5% of the public, they constitute larger shares of Establishment Liberals and Outsider Left (10% each).
Wide gaps across political typology groups in age, education and income
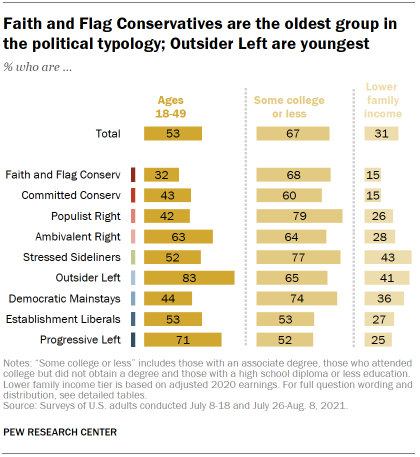
Age, education and income vary widely across the political typology groups. The youngest group by far is Outsider Left; fully 83% are under age 50, while 40% are ages 18 to 29. The second youngest group, Progressive Left, also is relatively young; 71% are younger than age 50.
The youngest Republican-oriented group is Ambivalent Right (63% are under age 50). The oldest group is also on the right: Only 32% of Faith and Flag Conservatives are ages 18 to 49, and just 8% in this group are younger than 30.
Populist Right stands out for having the largest share without a college degree. About eight-in-ten Populist Right (79%) have some college or less education. Among Democratic-oriented groups, Democratic Mainstays have the least formal education (74% have less than a college degree). Stressed Sideliners have an approximately similar share without a college degree (77%).
In addition to lower education levels, Stressed Sideliners (43%) and Democratic Mainstays (36%) are two of the three groups most likely to have lower family incomes. Though they also have lower education levels, only 26% of Populist Right have lower incomes. The two groups with the fewest adults with lower family incomes are Faith and Flag Conservatives and Committed Conservatives (in both, 15% are lower income).
Religious affiliation varies greatly across political typology groups
The share of Americans who identify as Christian has declined in recent years, while the share who describe their religious identity as atheist, agnostic or “nothing in particular” has grown. The decline in Christian identification has been particularly pronounced among Democrats: In 2019, Christians made up about half of Democratic voters (52%); in 2008, about three-quarters of Democrats (73%) were Christians.
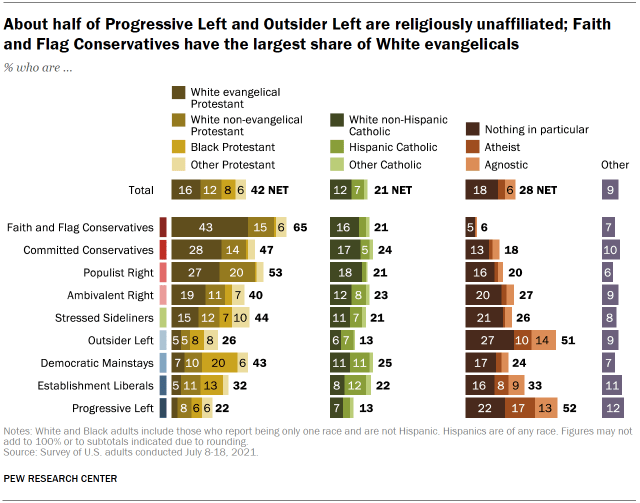
While about a quarter of all Americans (28%) claim no religious affiliation, religiously unaffiliated adults make up about half of Progressive Left (52%) and Outsider Left (51%) and a third of Establishment Liberals.
Faith and Flag Conservatives, in contrast, have the highest share of White evangelical Protestants (43%) of any political typology group. Committed Conservatives (28%) and Populist Right (27%) also have a higher share of White evangelical Protestants than other groups. Fewer than 10% in any of the Democratic-oriented groups are White evangelicals, though 20% of Democratic Mainstays are Black Protestants.
Catholics make up fairly similar shares of the political typology groups (between 20% to 25%), except for among Progressive Left and Outsider Left (13% each).
See additional demographic breaks, such as gender and age, in the detailed tables of the report.
Partisan identification and the typology groups
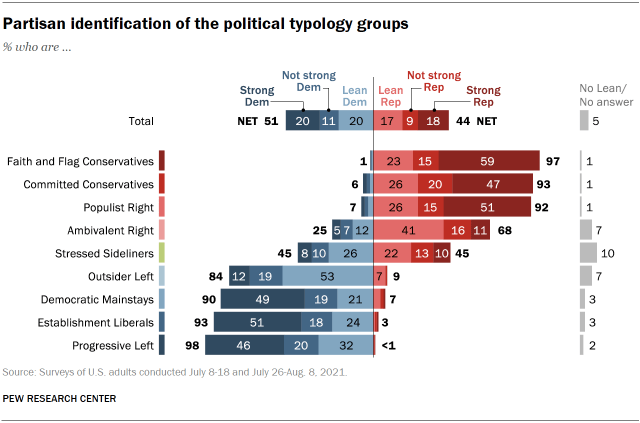
Most of the political typology groups have a clear partisan imprint: At least nine-in-ten Faith and Flag Conservatives (97%), Committed Conservatives (93%) and Populist Right (92%) identify as Republicans or lean toward the Republican Party, as do 68% of Ambivalent Right. Similarly, Progressive Left (98%), Establishment Liberals (93%), Democratic Mainstays (90%) and Outsider Left (84%) overwhelmingly identify as Democrats or Democratic leaners. Only Stressed Sideliners are evenly split between Republicans and Democrats.
Faith and Flag Conservatives have the greatest share of strong Republicans (59%), while strong Republicans make up about half of both Committed Conservatives (47%) and Populist Right (51%). Strong Democrats make up about half of Progressive Left (46%), Establishment Liberals (51%) and Democratic Mainstays (49%). There are relatively few strong partisans among Ambivalent Right, Stressed Sideliners or Outsider Left.
Outsider Left and Ambivalent Right stand out for being less likely to identify with a party. Roughly two-thirds of Outsider Left call themselves political independents (37%) or say they are “something else” other than Republican or Democrat (29%), though most of those who don’t identify with a party lean toward the Democratic Party (Democratic leaners make up 53% of all Outsider Left). Similarly, six-in-ten Ambivalent Right do not claim a partisan identification, though a majority of these (41% of all Ambivalent Right) lean toward the GOP. Most Stressed Sideliners also do not identify with a party, and those who do not are roughly equally split between those who lean to the Democratic Party (26% of all Stressed Sideliners) and those who lean Republican (22% of all Stressed Sideliners).
Majorities in all political typology groups value spending time with family
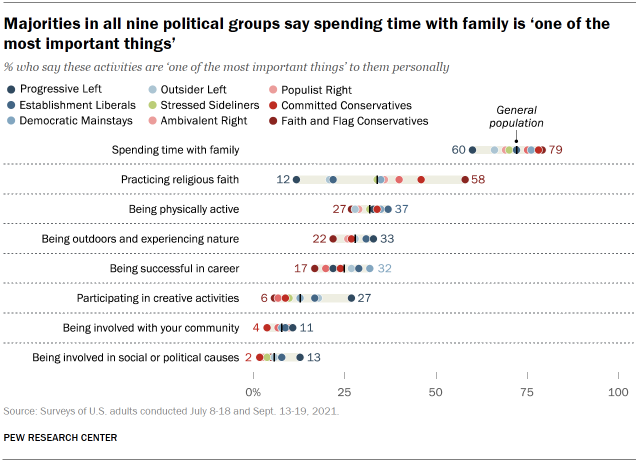
Despite their many political differences, there are relatively few gaps between the typology groups in what they value most in their personal lives.
The largest share in every group – and 72% of Americans overall – say spending time with family is one of the most important things in their personal lives, from a high of 79% among Faith and Flag Conservatives to a low of 60% among Progressive Left.
There are modest differences in views of the personal importance of other things – with one notable exception. Faith and Flag Conservatives are more likely than other typology groups to say practicing their religious faith is one of the most important things in their personal life (58% say this). Just 12% of Progressive Left say the same, the lowest share of any group.
Progressive Left (27%) also stand out from the other eight groups in the share who say participating in creative arts is one of the most important things in their life. The share saying this is 9 percentage points higher than the next closest group (18% of Outsider Left).
Where people would like to live; where they actually live
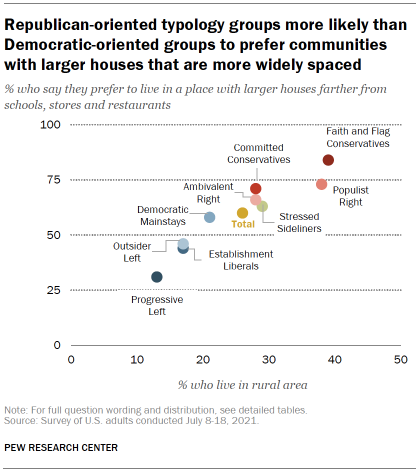
The political typology groups are divided over the types of communities where they would like to live – and where they actually live.
Overall, Republicans (73%) are more likely than Democrats (49%) to say they prefer communities where the “houses are larger and farther apart, but schools, stores and restaurants are several miles away.”
The groups with the largest shares of rural residents – Faith and Flag Conservatives (39% live in rural areas) and Populist Right (38% rural) – also are among the most likely to stay they prefer living in less-dense communities (84% and 73%, respectively).
Democratic-oriented groups are less likely than the average American to live in a rural area (26% of U.S. adults live in rural areas, compared with 21% or fewer among the Democratic groups). However, their preferences for larger houses vary. More Democratic Mainstays prefer communities with large houses (58%) than more walkable communities (41%), while Outsider Left (46% bigger vs. 54% walkable) and Establishment Liberals (44% vs. 55%) are more divided. Progressive Left are overwhelmingly in favor of more walkable communities (68% prefer this to 31% who want to live in communities with larger houses).
