Voters in the November 2024 election were about equally likely to vote in person on Election Day (34%), vote early in person (32%) or use an absentee or mail-in ballot (35%).
Election Day voting
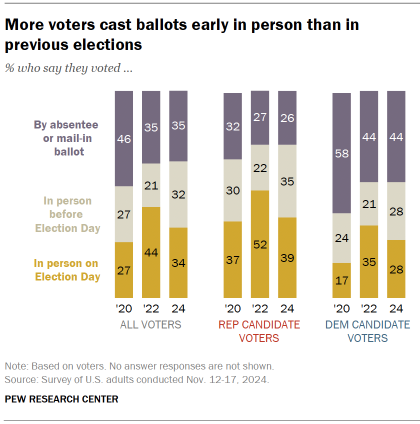
Roughly a third of voters (34%) report having cast their ballot on Election Day, a smaller share than the 44% of 2022 midterm voters who did this, but substantially more than the 27% who did so in 2020, in the midst of the coronavirus pandemic.
While the share of voters casting ballots in person on Election Day has steadily declined over the last two decades, it was the method used by a majority of voters until 2018.
Early in-person voting
Early in-person voting hit a high point this year: 32% of voters report having cast their ballots this way, up from 27% in 2020 and 21% in 2022.
Absentee and mail-in voting
The share who voted by absentee or mail-in ballot in this election is identical to the share of voters who voted by this method in the 2022 midterms. In 2020, 46% of voters voted by absentee or mail-in ballot.
Republicans continue to be more likely than Democrats to vote on Election Day, less likely to vote by mail. But rising shares in both parties voted early in person.
- 39% of Republican voters say they cast their vote in person on Election Day, compared with 28% of Democratic voters.
- In contrast, 44% of Democratic voters say they voted by mail or absentee, compared with 26% of Republican voters.
- 35% of Republican voters and 28% of Democratic voters report having voted early in person this year.
Some voters switched vote methods this year
An overwhelming majority of voters who had voted in elections prior to 2024 (87%) report having used a voting method that was familiar to them in this election. Yet about 13% used a new method of voting this November:
- 27% of early in-person voters say this was the first time they voted in person before Election Day.
- 9% of absentee or mail voters say this was their first time voting by absentee or mail-in ballot.
- 2% of voters who voted in person on Election Day say this was their first time doing so.
Most voters say it was easy to vote in the election
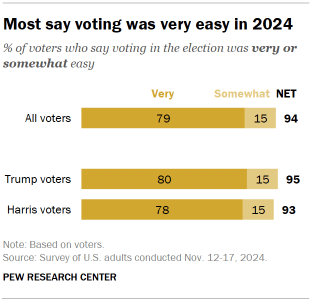
An overwhelming majority of voters (94%) say it was easy to vote in the election this November. About eight-in-ten (79%) describe voting as very easy, while 15% say it was somewhat easy. Just 6% of voters say voting was somewhat (5%) or very (2%) difficult.
Similar shares of voters who backed Donald Trump (95%) and Kamala Harris (93%) say that voting was easy. In 2020, 93% of Trump voters and 95% of Joe Biden voters said it was easy for them to cast their ballots.
Most in-person voters had little or no wait to vote
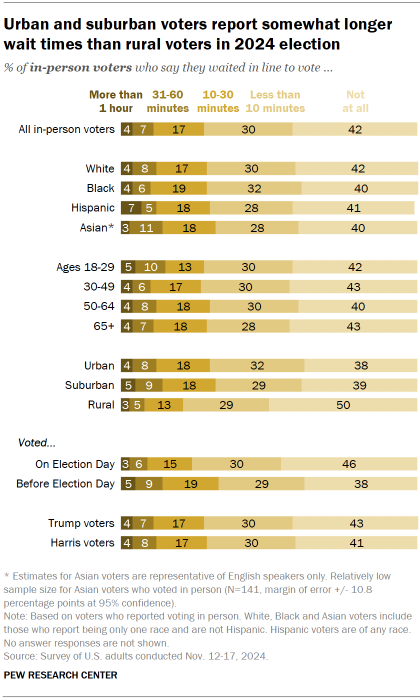
Roughly seven-in-ten voters who voted in person (72%) – either on Election Day or earlier – say they waited less than 10 minutes to vote, including 42% who report not waiting at all.
About three-in-ten in-person voters (28%) waited at least 10 minutes to vote, including 11% who waited for more than 30 minutes and 4% who waited more than an hour.
Voters report shorter wait times this year than in 2020.
Wait times of demographic groups
Race and ethnicity
Black, White, Hispanic and Asian in-person voters report similar wait times this year. In 2020, Black in-person voters reported waiting somewhat longer to vote than White or Hispanic in-person voters.
Age
Older and younger in-person voters reported similar wait times to cast their ballots.
Community type
As was the case four years ago, urban and suburban in-person voters had to wait somewhat longer to vote on average than in-person voters living in rural communities. Urban and suburban in-person voters are each about 10 percentage points more likely than those in rural areas to have waited more than 10 minutes.
Vote method
Those who voted in person before Election Day waited somewhat longer than those who voted on Election Day: 33% of early in-person voters waited more than 10 minutes, compared with 24% of Election Day in-person voters.
Candidate preference
In-person voters who backed Trump and those who backed Harris report nearly identical wait times. By contrast, in 2020 in-person Biden voters reported waiting longer to vote than Trump voters.
Nonvoters’ views of the election
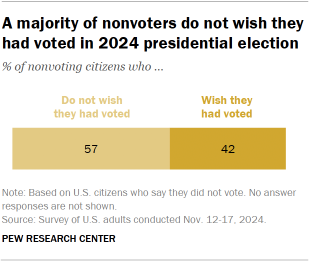
Among those eligible to vote who say they did not cast a ballot, 42% say they wish they had voted while 57% say they do not.
These shares are similar to other recent presidential elections: 45% of nonvoters said they wished they had voted following the 2020 election, and 44% said this postelection in 2016.
Nonvoters point to a number of reasons for their decisions not to vote:
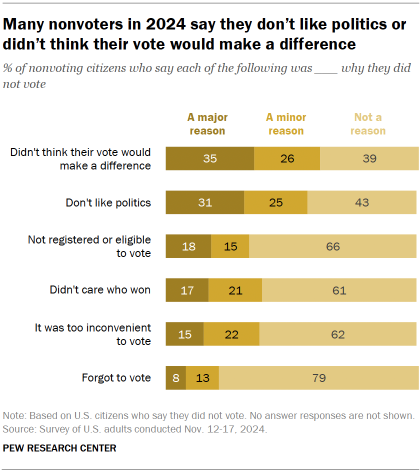
- 35% say thinking their vote would not make a difference was a major reason why they did not vote.
- 31% say that not liking politics was a major reason.
- 18% say it was that they are not registered or not eligible to vote.
- 17% say a major reason was that they did not care about the outcome.
- 15% say voting was inconvenient.
- 8% say a major reason was they forgot to vote.


