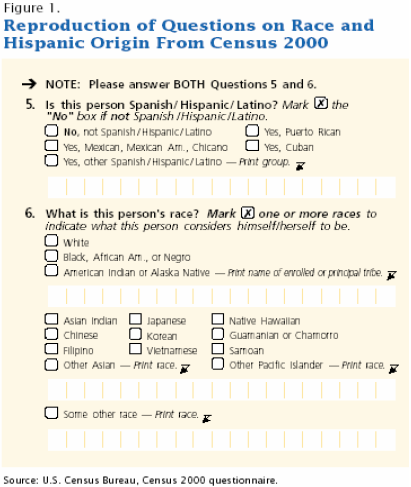
In a now familiar decennial ritual, Americans completed their Census questionnaires in the spring of 2000. Most identified their race by selecting one or more of the five standard race categories-white, black, American Indian, Asian, Native Hawaiian or Pacific Islander. But for millions of Americans the standard race categories did not fit (Figure 1). By the millions, these Americans ticked the last available box, identifying themselves as “some other race.” Numbered at 15 million, these some other race Americans constituted a group larger than Asians and American Indians combined. And size was not the only distinguishing characteristic of the SOR population. The vast majority are also of Hispanic origin.1 Their Hispanic ethnic origin was clear because the Census makes a distinction between the concepts of race and ethnicity and therefore tabulates Hispanic origin separate from race (Figure 1).2

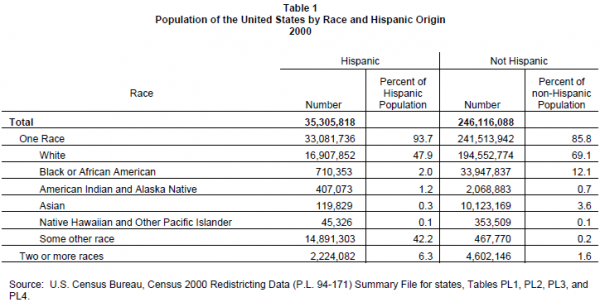
Among the 246 million non-Hispanic Americans, the SOR category was far less attractive. Fewer than half a million non-Hispanics ticked off “some other race” (Table 1). And these half million respondents amounted to less than 1 percent of all non-Hispanics. In contrast, the SOR category drew in 42 percent of the Hispanic population. In fact, among Hispanics only white Hispanics comprised a larger share of the Hispanic population (48 percent). Even with 31 different standard single and multiple race combinations to choose from, the vast majority of Hispanics in the United States fell into just these two categories. Nearly half identified themselves as white, a racial identity that they shared with the majority (69 percent) of non- Hispanics. And most of the remaining Hispanics, selected SOR, a category only sparsely populated by non-Hispanics.

This pattern of Hispanic race responses was not the result of an organized political campaign. In fact, estimates of the size and potential political clout of the Hispanic population are tied to the Hispanic origin question, not to the race question. So why do some Hispanics choose white while others choose SOR? Are these two groups of Hispanics one in the same in other respects? Evidence from several sources suggests that SOR Hispanics are different than white Hispanics, and the differences fall into a consistent pattern.
…SOR Hispanics are less educated, less likely to be citizens, poorer, less likely to speak English exclusively and are less often intermarried with non-Hispanic whites.
Using data from the 2000 Census this report details those differences, showing that SOR Hispanics are less educated, less likely to be citizens, poorer, less likely to speak English exclusively and are less often intermarried with non-Hispanic whites. Focus groups responses and attitudinal survey data support these findings. The socioeconomic profiles, the attitudes, the language usage and even the reported political behavior of SOR Hispanics consistently place them at a distance from non-Hispanic whites. In comparison, white-Hispanics consistently occupy the intermediate ground between SOR Hispanics and non-Hispanic whites. Even after removing immigrants from the analyses, compared to white U.S. born Hispanics, SOR Hispanics occupy a more marginalized socioeconomic position, more often report having experienced discrimination, and less often report behaviors consistent with strong civic bonds.
These results are significant because they show that for Hispanics racial identity is not immutable, rather it is at least partially a function of education, citizenship, civic participation and economic status. Although these results do not necessarily mean that the color lines in American society are fading. With the growth of the Hispanic population, the boundaries are shifting, at least for Latinos, to encompass factors other than skin color. The Latino experience suggests that whiteness remains an important measure of belonging, stature and acceptance. And, a large segment of the Hispanic population, SOR Hispanics, may be feeling left out.
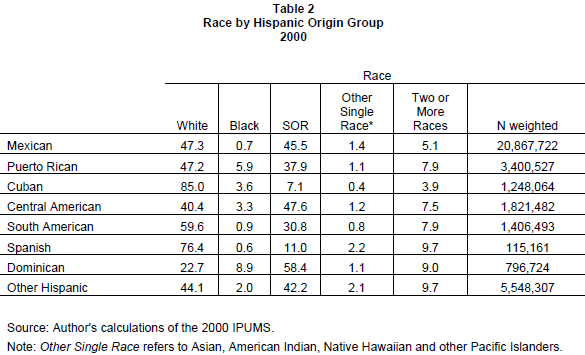
Much of the following data is derived from the 2000 Census, 5 percent sample. These data provide the best estimates of Hispanic population characteristics when the population is subdivided by factors such as nativity, country of origin, and race. Table 2 details the race and national origin of the nation’s Hispanic population.3 Focus group responses and the 2002 National Survey of Latinos (NSL) are also cited in this report.4 The NSL is a nationally representative sample of Hispanics in the United States. The characteristics of the population as measured by the 2002 NSL are consistent with the 2000 Census results reported here.

In some parts of this report the foreign-born, which comprise about 40 percent of the Hispanic population, are treated separately. We do this because unlike the native-born who are citizens at birth, an immigrant’s conceptions of race may have been formed prior to their arrival in the United States. Also, many behaviors and attitudes related to civic engagement may depend on immigration status. The following section addresses some of these issues. In other sections, where the emphasis is on the native-born, results for the foreign-born are also presented for comparison. In many of these comparisons, the differences between SOR Hispanics and white Hispanics are more exaggerated in the native born than in the foreign born.


