The differences between the Hispanic population and the Hispanic electorate are more than just a matter of size. Latinos who are eligible to vote and those who actually do vote have distinctly different characteristics than the Latino population as a whole. The demographic factors and the political behavior described above have created a situation in which one segment of the Hispanic population acts as a proxy in the democratic process for the rest, and the segment exercising that proxy is unlike the larger, non-eligible, non-voting part of the population in many respects. To begin with, they do not necessarily speak the same language.
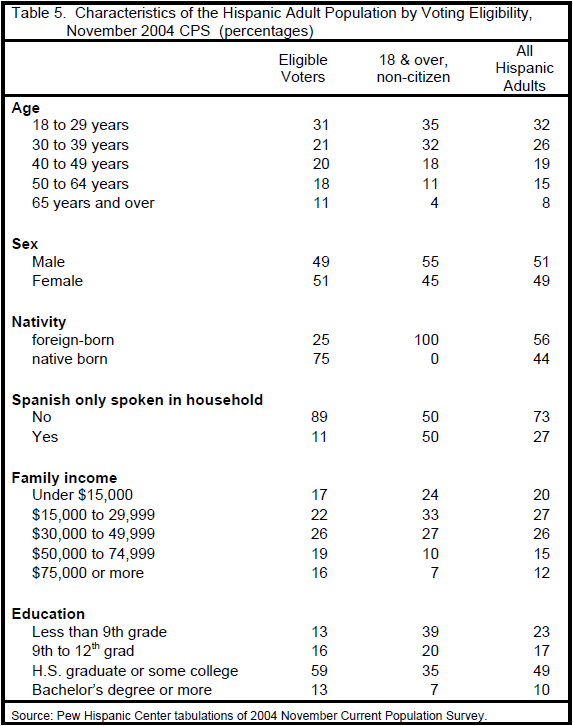
The most obvious difference involves nativity. Because so many Latino immigrants are not eligible to vote, a far greater share of the Hispanic adult population (56%) is foreign-born than among those who voted in 2004 (28%) and, of course, the adult population that is not eligible to vote because it lacks citizenship is entirely foreign-born. (See Table 5 below.)
Differences in nativity bring with them differences in language use. Surveys show that virtually all native-born Latinos speak English fluently while about a third are bilingual and almost none speak only Spanish. Meanwhile, virtually all of the foreign-born speak Spanish, about a quarter are bilingual and almost none speak only English (Pew Hispanic Center & Kaiser Family Foundation, 2002). The CPS does not measure bilingualism, but it does identify people who live in households where only Spanish is spoken. Less than 11 percent of eligible voters and less than 9 percent of actual voters live in Spanish-only households compared to 27 percent of the entire adult population and 50 percent of the adult non-citizens.
Given that the growth of the immigrant population is fed by the arrival of young adults, it is not surprising that the population as a whole is somewhat younger than the electorate. In the entire adult population, 58 percent of Hispanics are less than 40 years old compared to 52 percent of the eligible voters. Two-thirds of adult non-citizen Hispanics are under 40.
Hispanic eligible voters are somewhat more affluent, for example 34 percent earn family incomes of more than $50,000 a year compared to 27 percent of the Hispanic adult population as a whole. And the electorate is better educated. Among eligible voters 28 percent failed to complete high school compared to 40 percent of the entire adult population. These differences are more marked when one adds comparisons to the non-citizen adults, who are the least educated and least affluent, and to actual voters, who are more affluent and better educated. (See Table B4, Appendix B.)


