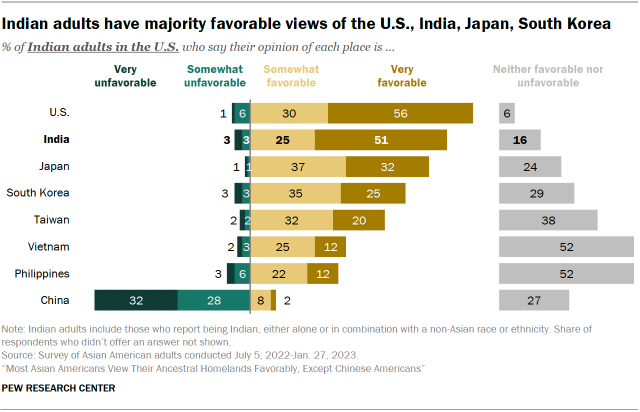
Indian Americans are more likely to have a favorable opinion of the United States than of any other place our survey asked about. Nearly nine-in-ten Indian adults say this, including 56% who have a very favorable view of the U.S.
Roughly three-quarters of Indian adults in the U.S. say their opinion of India is very or somewhat favorable, compared with 5% who offer unfavorable views of the country and 16% who have neither favorable nor unfavorable views. Indian Americans’ views of India are also substantially more positive than other Asians’ views: 76% vs. 23%.8
Though similar shares of U.S.-born Indian adults and Indian immigrants have a favorable opinion of India, those born in the U.S. are more like than those born abroad to say they have a neutral view of the country (31% vs. 13%). And among immigrants, those who are not U.S. citizens are more likely to have favorable views of India than those who are naturalized citizens (87% vs. 73%).

“I would say my relationship with India definitely changed. [When I visited India] when I was younger, … I felt – especially with how coming from the U.S. we were treated, I felt like India was primitive in a lot of ways…. And as I got older, … my view of India was often formed through the White lens of the exotic…. So my relationship has changed dramatically…. [Now when I visit India, I try] to absorb the culture, and understand it, and kind of in some ways deconstruct all of these myths that I’ve had built up in my head. That’s been kind of in many ways put upon me either through education or just the society I exist in.”
– U.S.-born woman of Indian origin, age 43
Most Indian adults also see Japan (70%) and South Korea (60%) in a favorable light. About half say they have a favorable opinion of Taiwan.
When asked about their opinion of Vietnam and the Philippines, about half of Indian Americans say they have neither a favorable nor unfavorable opinion of each country (52% each). Among those who do indicate favorability, views skew more positive than negative: 37% of Indian adults say they view Vietnam favorably, compared with only 5% who view it unfavorably. And 34% say they have a positive opinion of the Philippines, compared with 9% who say the opposite.
Indian Americans’ views of China are much more negative. Some 59% of Indian adults say they have an unfavorable opinion of China, including 32% who report very unfavorable opinions of the country. Overall, Indian adults are 12 percentage points less likely than other Asian adults to say their opinion of China is favorable.
Indian Americans’ views vary by gender and partisan identity
There are some differences in Indian Americans’ views by gender. On views of Taiwan and Vietnam, men are more likely than women to have favorable views of each country. Views of China are an exception to this pattern: A higher share of Indian men than women have an unfavorable opinion (66% vs. 53%). This stems from Indian men being more likely to have a very unfavorable opinion of China than Indian women (40% vs. 23%).
Partisan identity also colors how Indian adults view some places. Indian adults who are Democrats or lean to the Democratic Party are more likely than Indian Republicans or Republican leaners to have favorable views of South Korea and Taiwan.

Interest in moving to India differs across time spent in the U.S.
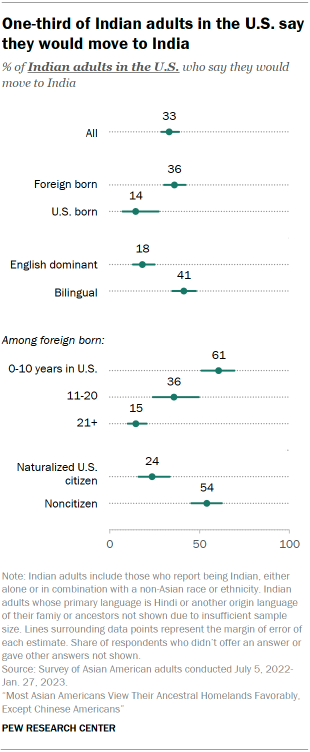
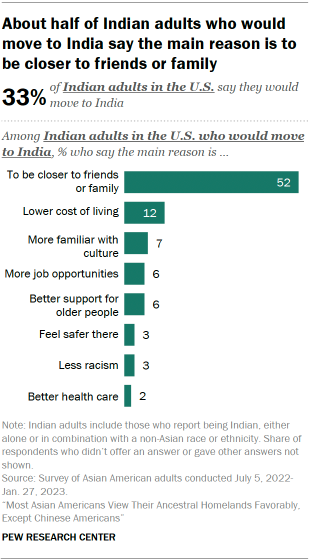
When asked whether they would ever move to India, 33% of Indian adults say they would, compared with 65% of Indian adults who say the opposite.
Foreign-born Indian adults are more likely than those born in the U.S. to say they would move to India (36% vs. 14%). Immigrants who have been in the U.S. for less time are also particularly likely to be open to moving back relative to those who have been in the U.S. for longer.
Nearly all U.S.-born Indian adults say they would not move to India (85%).
“I remember [my last trip to India] was one that I really … spent time with my grandma and grand aunt as much as I could…. [P]revious India trips growing up were this cycle of getting there for the whole summer and initially not liking it at all and then slowly like just kind of falling in love with my family and the people around me.”
– U.S.-born man of Indian origin, age 26

Among the third of Indian adults who say they would move to India, about half say the main reason for the move is to be closer to loved ones. Smaller shares cite lower cost of living (12%), more familiarity with Indian culture (7%), more job opportunities (6%), and better elder care (6%) as the main reason they would move there.
“There is a difference between the standard of living in India and the standard of living in the USA. The medical facilities available here are better than in India. It feels safer here too. The education that we can give to our children here is of a very high standard. Competition here is also very less than in India, so whatever field one wants to choose for oneself, they will get it here.”
– Immigrant woman of Indian origin, age 46 (translated from Hindi)


