Though Latinas have collectively seen socioeconomic gains, their educational and economic circumstances are varied. Younger Latinas and U.S.-born Latinas, for instance, are more likely to report having a bachelor’s degree than older and immigrant Latinas, respectively. This chapter explores how other characteristics such as spouse or partner ethnicity and presence of their children at home are associated with differences in educational and economic outcomes.
Bachelor’s degrees among Latinas
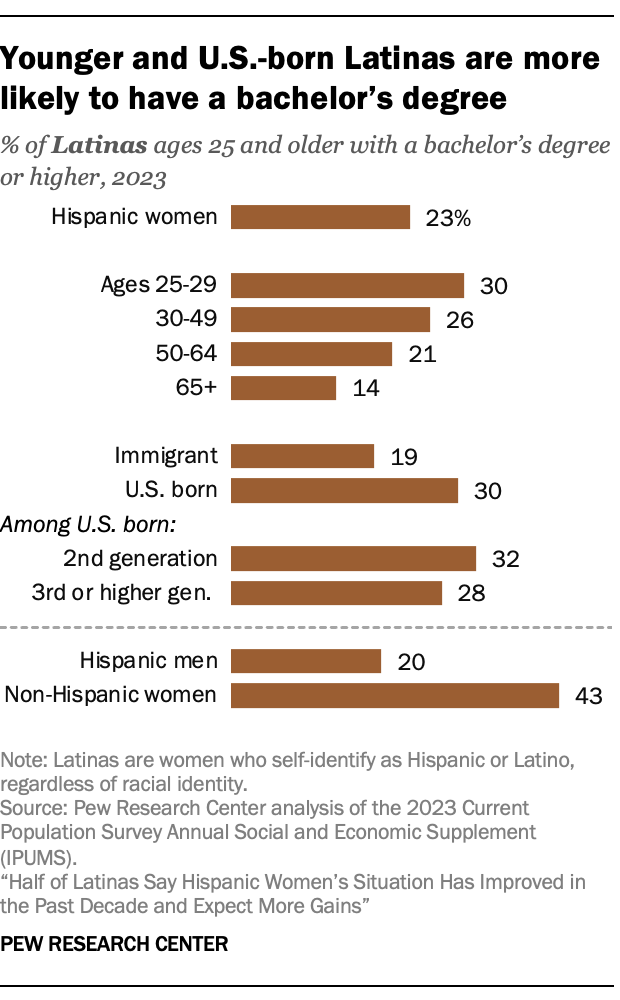
Some Latinas are more likely than others to have a bachelor’s degree.
- Age: Younger Latinas (ages 25 to 29) are about twice as likely as older Latinas (ages 65 or older) to hold a bachelor’s degree (30% vs. 14%).
- Nativity: U.S.-born Latinas are more likely than those born outside the U.S. to hold a bachelor’s degree (30% vs. 19%).
Labor force participation rates among Latinas
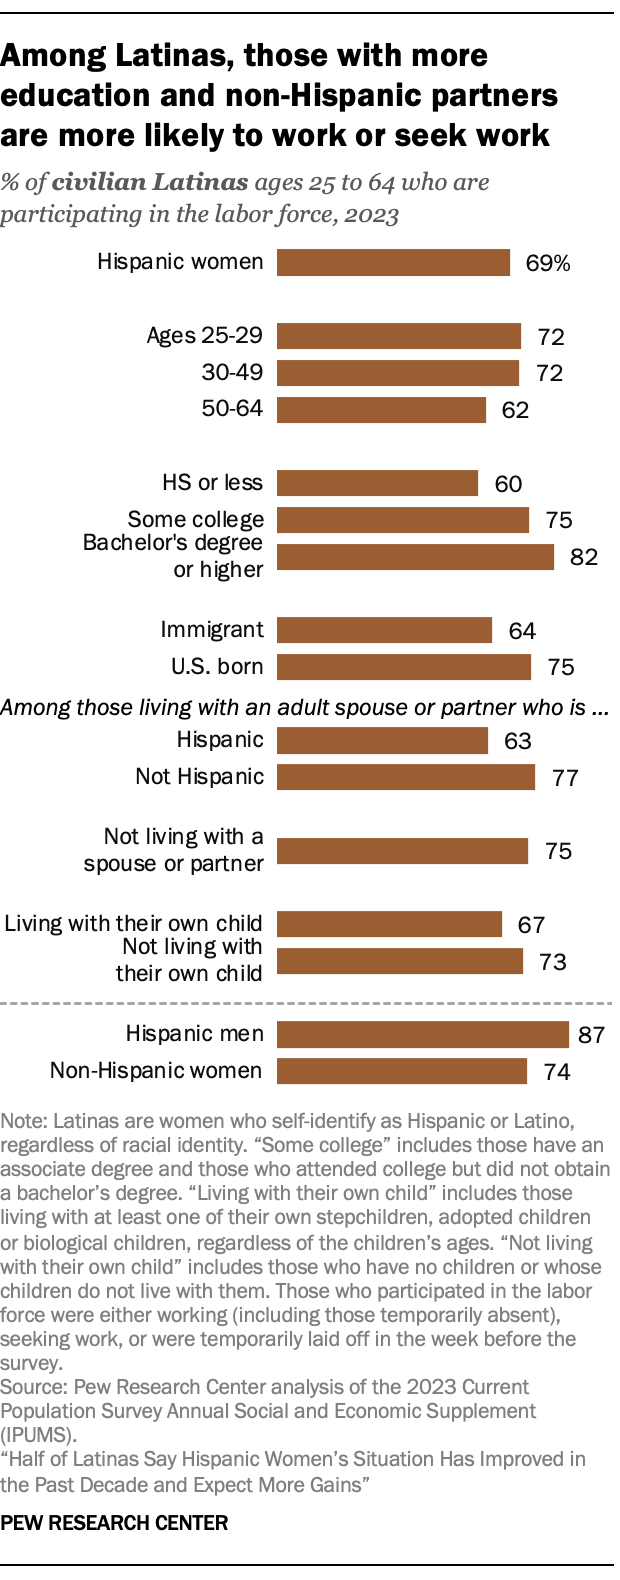
Though labor force participation rates have increased in the last two decades for Latinas overall, some are more likely to be employed or seeking work. Among civilians ages 25 to 64:
- Education: Latinas with a bachelor’s degree or higher are more likely than those with a high school education or less to participate in the labor force (82% vs. 60%).
- Nativity: U.S.-born Latinas are more likely than Latinas born outside the U.S. to participate in the labor force (75% vs. 64%).
- Spouse or partner: Latinas who are living with a Hispanic spouse or partner are less likely to work or seek work than those living with a non-Hispanic partner (63% vs. 77%).
- Children at home: Latinas with children in the home are less likely to work or seek work than Latinas without (67% vs. 73%).
Occupations among working Latinas
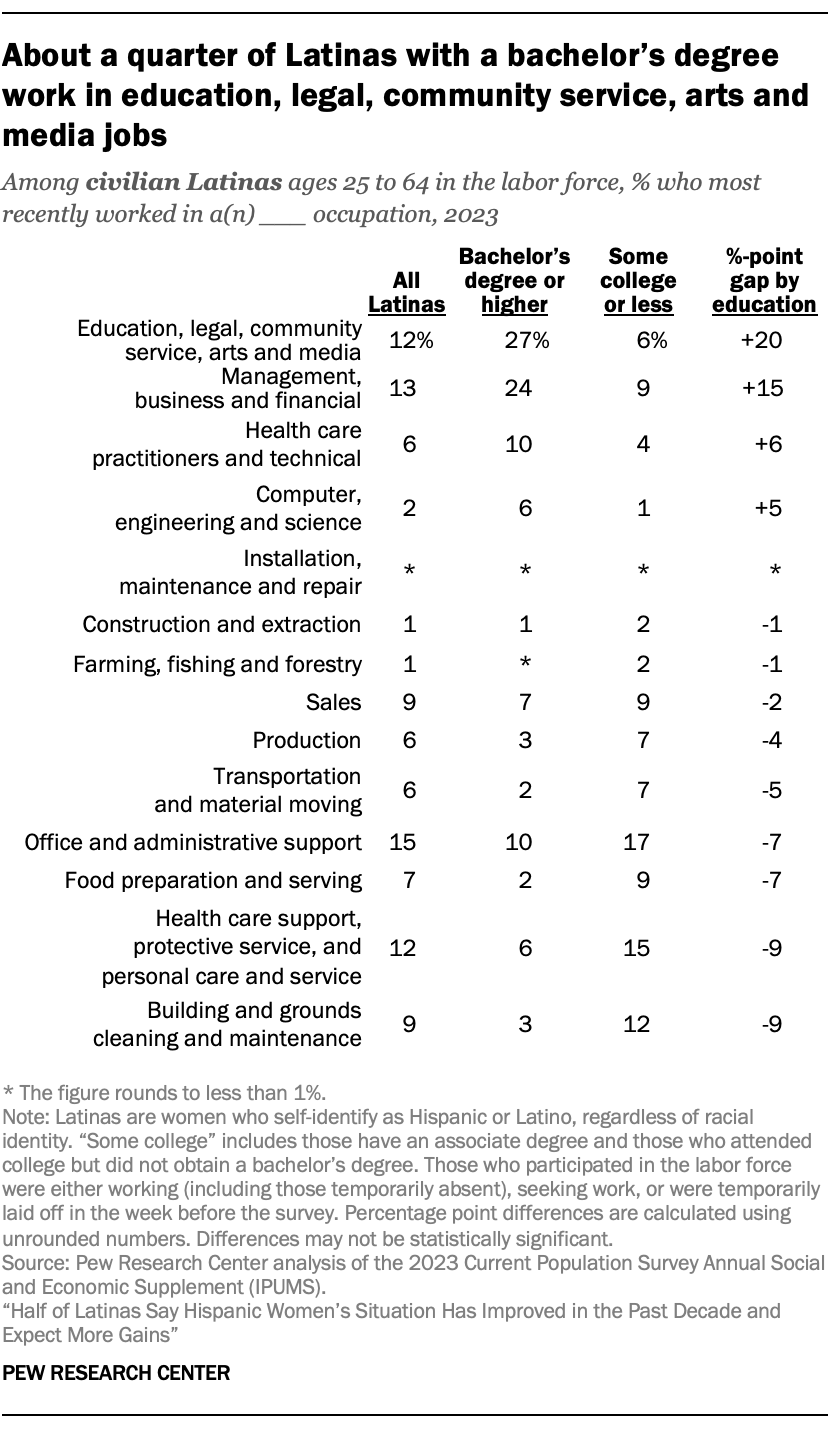
Among civilian Latinas ages 25 to 64 who were employed or looking for work in 2023, 15% work in office and administrative support occupations. Similar shares work in management, business and financial occupations (13%) and education, legal, community service, arts and media occupations (12%).
The kinds of occupations Latinas most recently worked in are also associated with whether they have a bachelor’s degree. Among civilian Latinas ages 25 to 64 who were employed or looking for work in 2023:
- Those with a bachelor’s are most likely to have education, legal, community service, arts and media jobs (27%) or management, business and financial jobs (24%).
- For those without a bachelor’s, the most common occupational groups are office and administrative support (17%) and health care support, protective service, and personal care and service (15%).
- Those with a bachelor’s degree are less likely than those without one to work in health care support, protective service, and personal care and service occupations (6% vs. 15%, respectively) and building and grounds cleaning and maintenance occupations (3% vs. 12%).
Earnings among Latinas
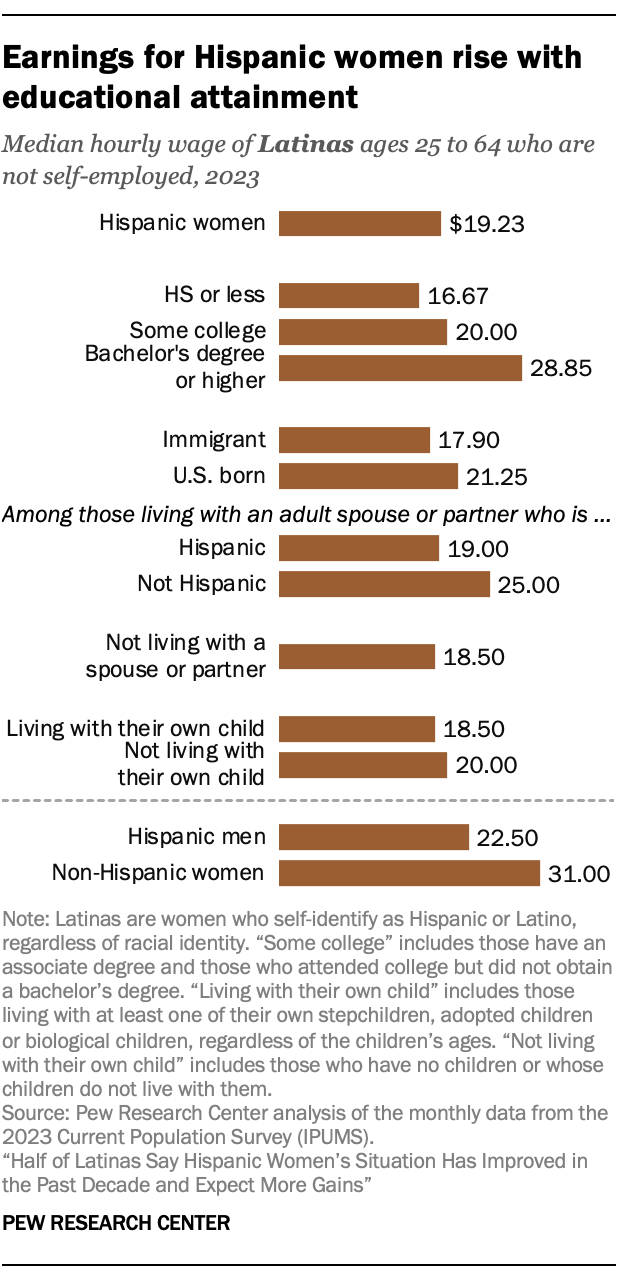
Though wages have increased for Latinas overall in the last two decades, some earn more than others. Among Latinas ages 25 to 64 who are not self-employed:
- Education: Latinas with a bachelor’s degree make $28.85 per hour (at the median) while those with a high school education or less earn $16.67 per hour.
- Nativity: U.S.-born Latinas make more per hour than immigrant Latinas ($21.25 vs. $17.90).
- Spouse or partner: Hispanic women who live with a spouse or partner earn roughly the same as those without a spouse or partner. However, Hispanic women living with a non-Hispanic spouse or partner make significantly more at the median than those living with a Hispanic spouse or partner ($25.00 vs. $19.00).
- Children at home: Latinas living with their children earn about the same as Latinas not living with their children ($18.50 vs. $20.00).
Latinas as breadwinners in 2022
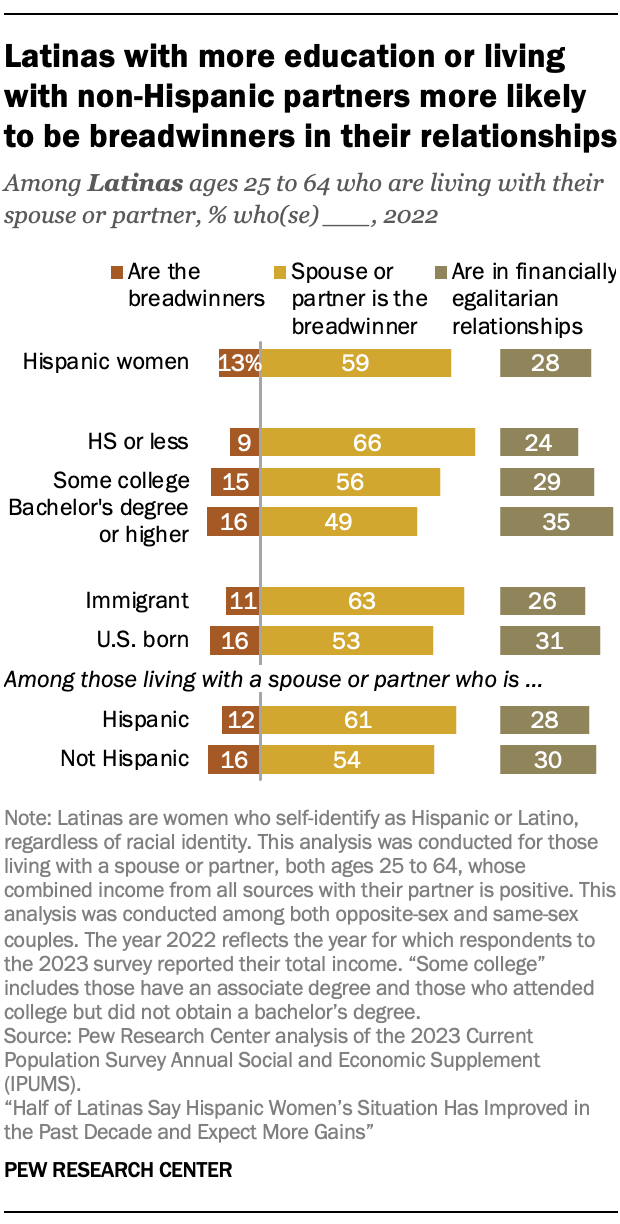
Overall, 13% of Hispanic women living with their spouse or partner are the breadwinners of their couples. Another 28% of Latinas are in financially egalitarian relationships, while the remaining 59% are living with a breadwinner spouse or partner.
Some Latinas are more likely than others to be either their relationships’ breadwinners or in financially egalitarian relationships with their spouse or partner.
- Education: Latinas with a bachelor’s degree or higher were more likely than those with a high school education or less to be breadwinners (16% vs. 9%, respectively) or in financially egalitarian relationships (35% vs. 24%).
- Spouse or partner: Hispanic women living with a partner or spouse who is not Hispanic were more likely than those with a Hispanic spouse or partner to be the breadwinner of their relationship (16% vs. 12%, respectively). They were also less likely than their Hispanic-partnered counterparts to say their spouse or partner was the breadwinner (54% vs. 61%).


