Who is in it and key trends from 2010 to 2023

This report examines key changes in the economic status of the Asian American middle class from 2010 to 2023 and its demographic attributes in 2022. The historical analysis is based on data from the Annual Social and Economic Supplements (ASEC) of the Current Population Survey (CPS). The demographic analysis is based on data from the American Community Survey (ACS). The data is sourced from IPUMS CPS and IPUMS USA, respectively.
The CPS, a survey of about 60,000 households, is the U.S. government’s official source for monthly estimates of unemployment. The CPS ASEC, conducted in March each year, is the official source of U.S. government estimates of income and poverty. Data on Asian Americans alone is available in the CPS starting in 2003. Our analysis of CPS data starts with the 2010 CPS ASEC, which records the incomes of households in 2009. The latest available CPS ASEC file is for 2023, which reports on household incomes in 2022.
The public-use version of the ACS is a 1% sample of the U.S. population, or more than 3 million people. This allows for a detailed study of the demographic characteristics of the middle class, including its status in U.S. metropolitan areas. ACS data is available only from 2005 onward. The latest available ACS data is for 2022.
In some instances, the demographic analysis uses data from the 5-year ACS for the period 2018-2022. This file contains data from the five ACS surveys conducted over this period and represents a 5% sample of the U.S. population, or more than 15 million people. We exclude the data for 2020 because the COVID-19 pandemic had a significant impact on data collection in that year. The resulting file with four years of data – about 12 million people – was used to study smaller demographic groups. Refer to our methodology for more details.
Middle-income households are defined as those with an income that is two-thirds to double that of the U.S. median household income, after incomes have been adjusted for household size. Lower-income households have incomes less than two-thirds of the median, and upper-income households have incomes that are more than double the median. When using American Community Survey (ACS) data, incomes are also adjusted for cost of living in the areas in which households are located.
Estimates of household income are scaled to reflect a household size of three and expressed in 2023 dollars. In the Current Population Survey (CPS), household income refers to the calendar year prior to the survey year. Thus, the income data in the report refers to the 1970-2022 period, and the share of Americans in each income tier from the CPS refers to the 1971-2023 period.
The demographic attributes of Americans living in lower-, middle- or upper-income tiers are derived from ACS data. Except as noted, estimates pertain to the U.S. household population, excluding people living in group quarters.
The terms middle class and middle income are used interchangeably in this report.
The terms Asian and Asian American are used interchangeably in this report to refer to people who self-identified with one or more Asian race or origin and are not Hispanic. Households are grouped by the race and ethnicity of the survey reference person, or the household head.
U.S. born refers to individuals who are U.S. citizens at birth, including people born in the 50 U.S. states, the District of Columbia, Puerto Rico or other U.S. territories, as well as those born elsewhere to at least one parent who is a U.S. citizen. The terms foreign born and immigrant are used interchangeably in this report. They refer to people who are not U.S. citizens at birth.
Occupations describe the broad kinds of work people do on their job. For example, health care occupations include doctors, nurses, pharmacists and others who are directly engaged in the provision of health care. Industries describe the broad type of products companies produce. Each industry encompasses numerous occupations. For example, the health care and social assistance industry provides services that are produced by a combination of doctors, managers, technology and administrative staff, food preparation workers, and workers in other occupations.
The share of Asian Americans who are in the U.S. middle class has held steady since 2010. In 2023, 48% of Asian Americans lived in middle-class households, about the same share as in 2010, according to a new Pew Research Center analysis of government data.
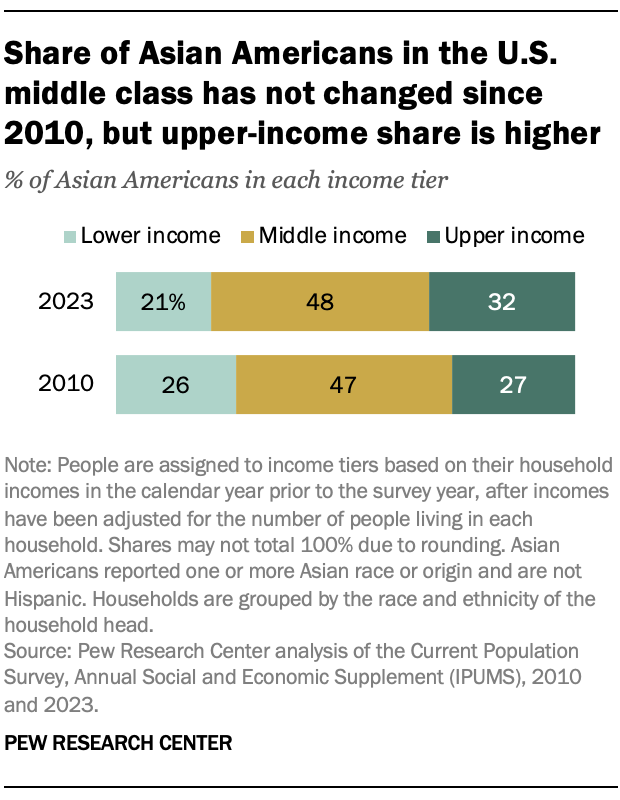
But their economic status overall has improved since 2010. The share of Asian Americans in the upper-income tier increased from 27% in 2010 to 32% in 2023, and the share in the lower-income tier decreased from 26% to 21%. The share of Asian Americans in the lower-income tier in 2023 was less than the share of Americans overall (30%) in that tier, and their share in the upper-income tier was greater than among Americans overall (19%).
As Asian Americans moved up the income ladder, household incomes also increased at a faster rate for those at the higher rungs of the ladder. Consequently, the share of the total income of Asian American households held by the middle class has fallen since 2010, and the share of the upper-income tier has increased.
Our report focuses on the economic status of Asian Americans in the U.S. middle class. First, we examine changes in the financial well-being of those in the middle class and other income tiers since 2010. This is based on data from the Annual Social and Economic Supplements (ASEC) of the Current Population Survey (CPS), conducted in 2010 and 2023.
Jump to:
Then, we report on the attributes of Asian Americans who were more or less likely to be middle class in 2022. Our focus is on their origin group, age, gender, marital and veteran status, place of birth, education, occupation, industry, and metropolitan area of residence. These estimates are derived from American Community Survey (ACS) data and differ slightly from the CPS-based estimates. In part, that is because incomes can be adjusted for the local area cost of living only with the ACS data. (Refer to the methodology for details on these two data sources.)
This analysis and an accompanying report on the American middle class overall are, in part, updates of previous work by the Center. But they offer much greater detail on the demographic attributes of the American middle class.
Asian Americans represented 6% of the U.S. population in 2022. Following are some key facts about the state of the Asian American middle class:
In our analysis, “middle-income” Americans are those living in households with an annual income that is two-thirds to double the national median household income. The income it takes to be middle income varies by household size, with smaller households requiring less to support the same lifestyle as larger households. It also varies by the local cost of living, with households in a more expensive area, such as Honolulu, needing a higher income than those in a less expensive area, such as Wichita, Kansas.
We don’t always know the area in which a household is located. In our two data sources – the Current Population Survey, Annual Social and Economic Supplement (CPS ASEC) and the American Community Survey (ACS) – only the latter provides that information, specifically the metropolitan area of a household. Thus, we aren’t able to adjust for the local cost of living when using the CPS to track changes in the status of the middle class over time. But we do adjust for the metropolitan area cost of living when using the ACS to determine the demographic attributes of the middle class in 2022.
In the 2023 CPS ASEC data, which reports income for 2022, middle-income households with three people have incomes ranging from about $61,000 to $183,000 annually. “Lower-income” households have incomes less than $61,000, and “upper-income” households have incomes greater than $183,000.
In the 2022 ACS data, middle-income households with three people have incomes ranging from about $62,000 to $187,000 annually, with incomes also adjusted for the local area cost of living. (Incomes are expressed in 2023 dollars.)
The boundaries of the income tiers also vary across years as the national median income changes.
The terms “middle income” and “middle class” are used interchangeably in this report for the sake of exposition. But being middle class can refer to more than just income, be it education level, type of profession, economic security, home ownership or social and political values. Class also could simply be a matter of self-identification.
Asian households in all income tiers had higher incomes in 2022 than in 2009, after adjusting for inflation. But gains for upper-income households were greater than the gains for middle- and lower-income households.
The median income of Asian households in the U.S. middle class increased from about $97,200 in 2009 to $112,400 in 2022, or 16%. Meanwhile, the median income of Asian households in the upper-income tier increased 26%, from about $220,500 to $277,600. (Incomes are scaled to a three-person household and expressed in 2023 dollars.)
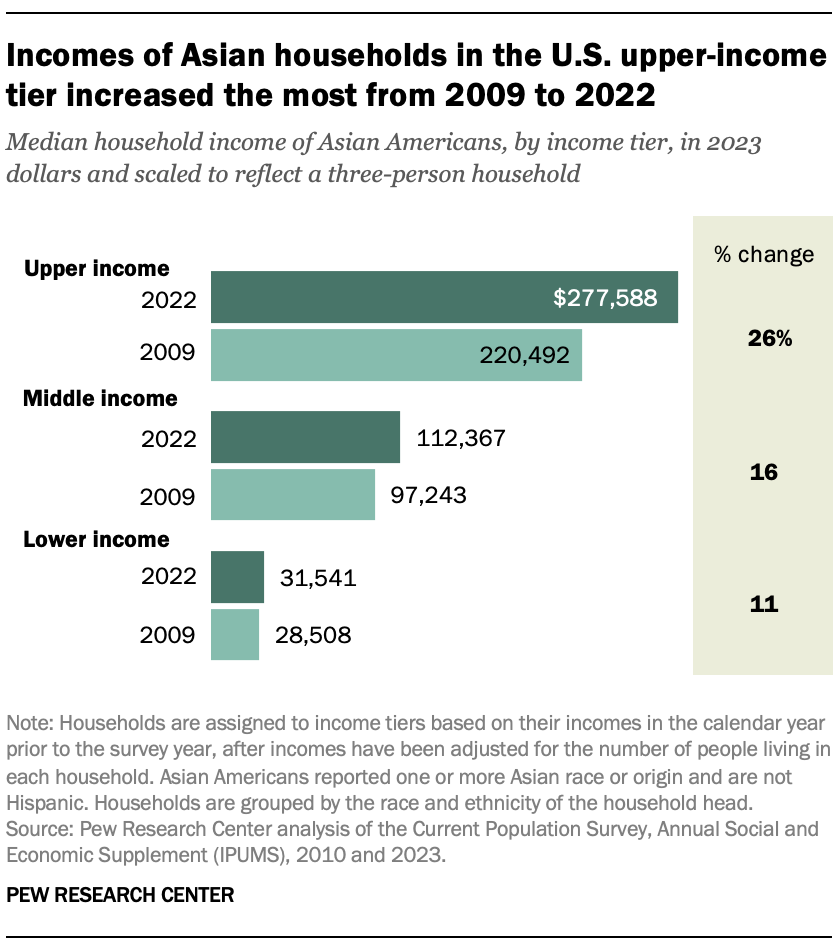
The median income for lower-income Asian households increased from about $28,500 in 2009 to $31,500 in 2022, or 11%.
Thus, there is now more of a gap between the incomes of upper-income Asian households and those in other income tiers. In 2022, the median income of upper-income Asian households was 8.8 times that of lower-income households, up from 7.7 in 2009. It was 2.5 times the median income of middle-income households in 2022, up from 2.3 in 2009.
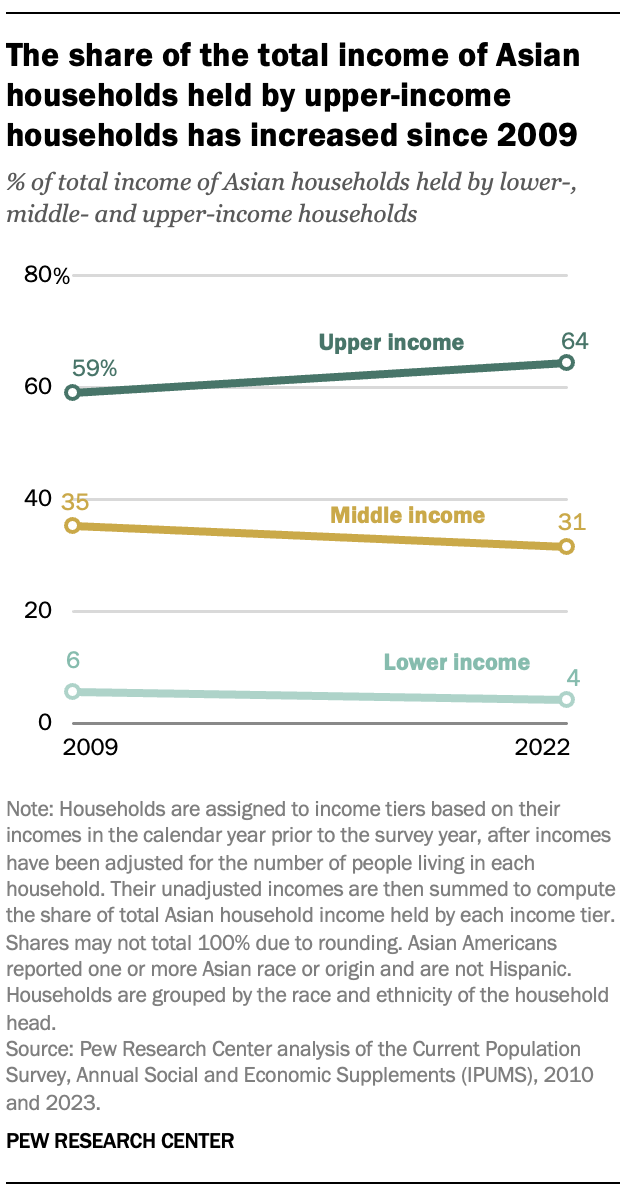
Among Asian households, the share of overall household income held by the middle class has fallen since 2009. In 2009, middle-income Asian households accounted for 35% of the total income of all Asian households. This share fell to 31% in 2022, despite no significant change in the share of Asian households who were in the middle class.
Over the same period, the share held by upper-income Asian households increased from 59% in 2009 to 64% in 2022. In part, this is because of the increase in the share of Asian Americans who are in the U.S. upper-income tier.
The share of the total income of Asian households held by lower-income households edged down from 6% in 2009 to 4% in 2022.
Asian Americans were considerably more likely than Americans overall to live in upper-income households in 2022. In that year, 27% of Asian Americans were in the upper-income tier, compared with 17% of Americans overall.
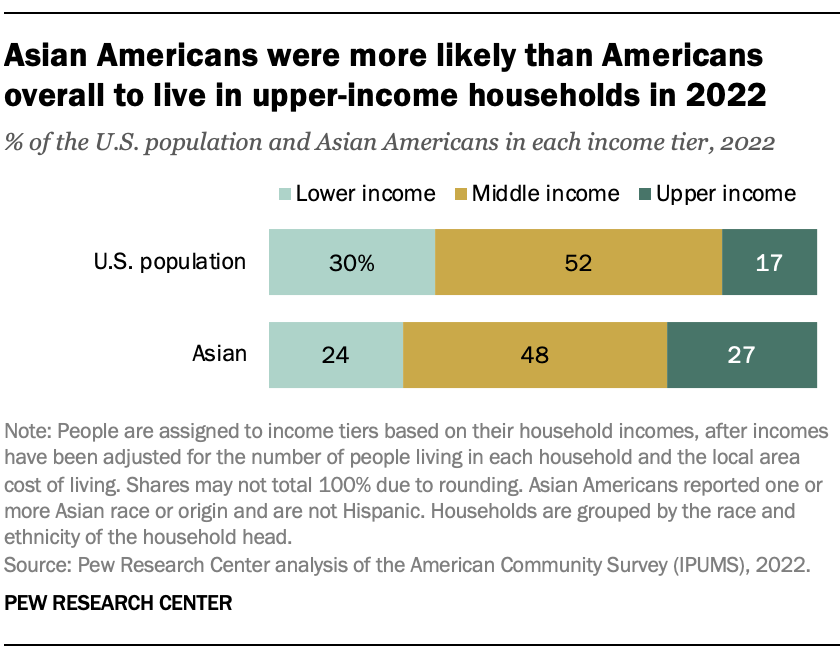
Conversely, Asian Americans were less likely to be in the middle- or lower-income tier in 2022. Some 48% of Asian Americans were in the middle class in 2022 and 24% were in the lower-income tier. That compared with 52% and 30%, respectively, among Americans overall.
The economic status of Asian Americans varies greatly across origin groups. Over the period from 2018 to 2022, about four-in-ten Asian Indians (39%) and three-in-ten Chinese (29%) were in the upper-income tier.
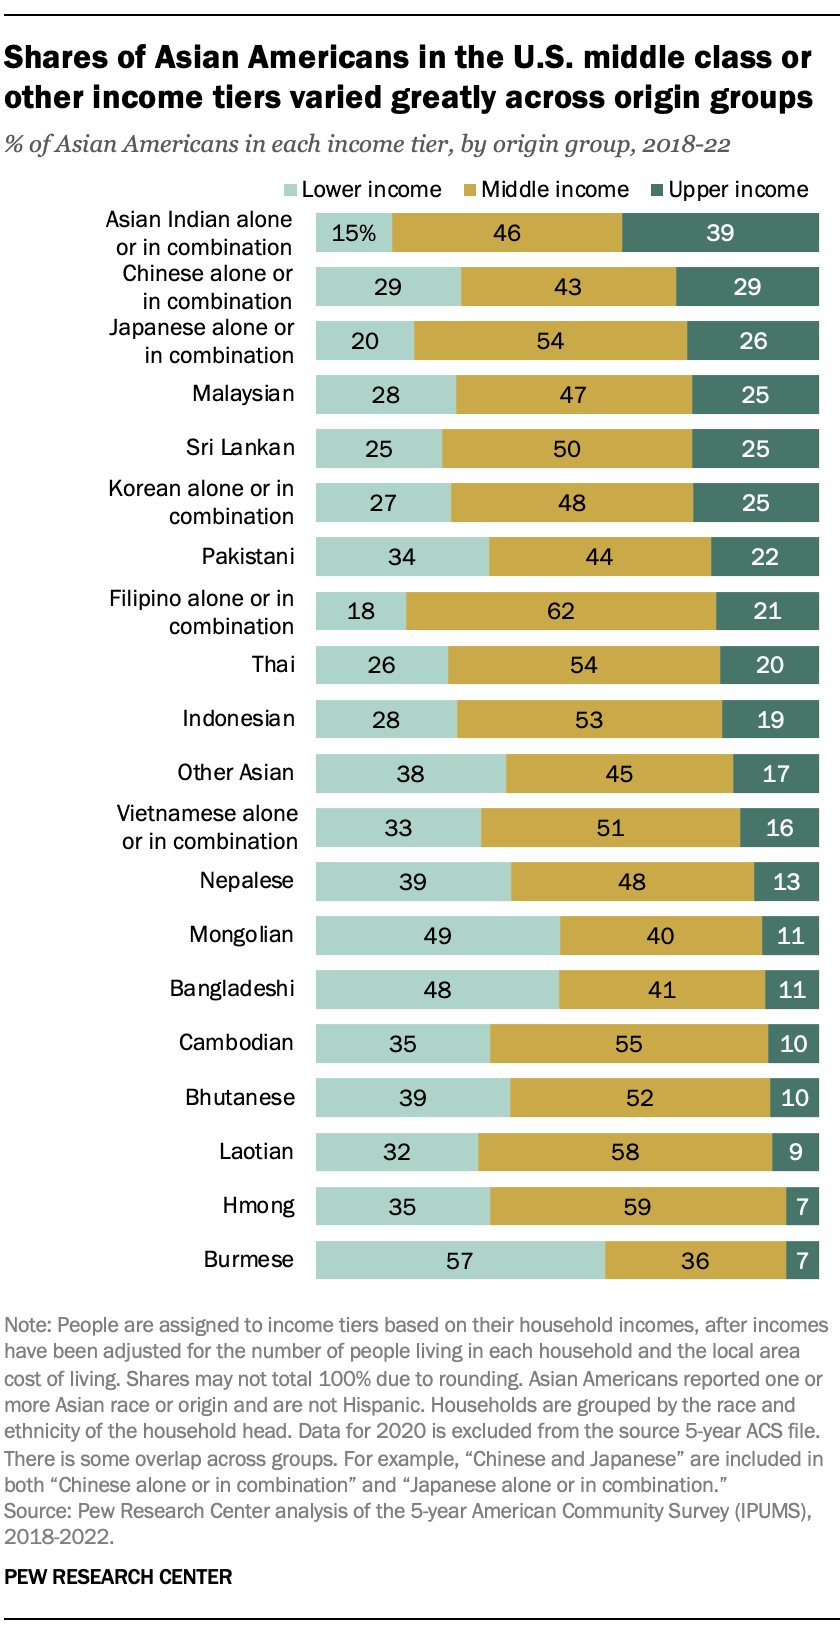
But while only 15% of Indians were in the lower-income tier, 29% of Chinese were in that tier. These two origin groups accounted for 48% of the Asian American population over the 2018 to 2022 period.
Among the Asian origin groups, the share of the population in the middle class among Filipino, Laotian and Hmong Americans was near 60%. There were three Asian origin groups – Mongolian, Bangladeshi and Burmese – among whom about half or more were in the lower-income tier from 2018 to 2022.
(In this section, references to Asian Indian, Chinese and Filipino include those who also identify as another race or origin. For example, Chinese include those who identified as “Chinese and Taiwanese.”)
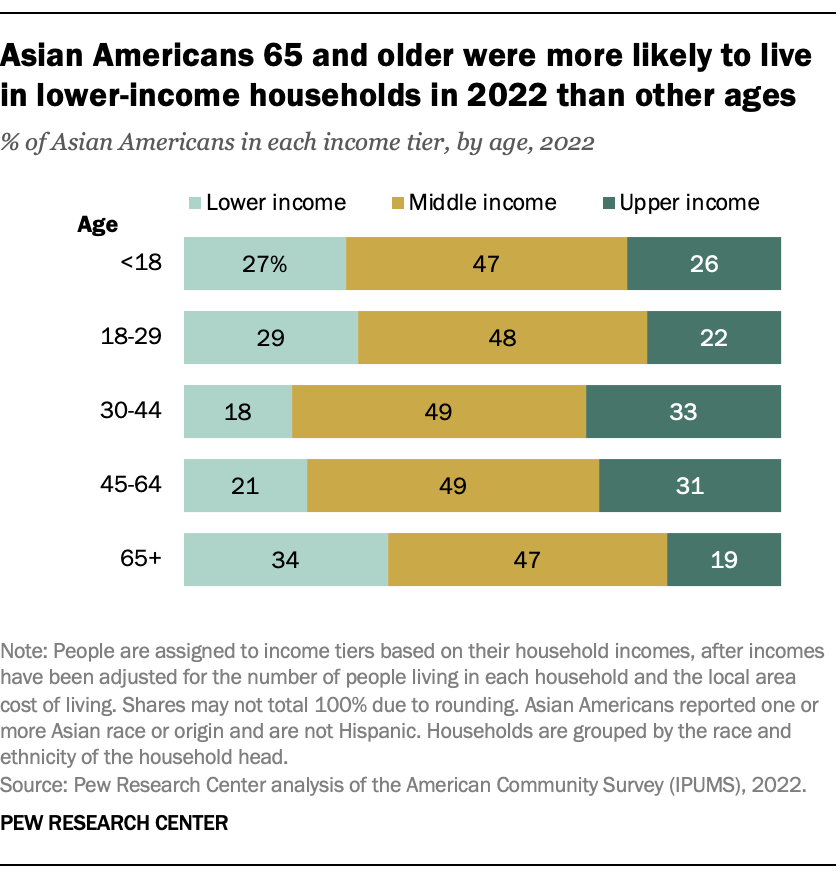
About a third of Asian adults 65 and older (34%) lived in lower-income households in 2022. That compared with about one-in-five among Asian adults ages 30 to 44 (18%) or 45 to 64 (21%).
The share of Asian Americans in the U.S. middle class did not vary much by age – nearly half of each age group were in the middle class in 2022. But while about a third of Asian adults ages 30 to 44 and 45 to 64 were in the upper-income tier (33% and 31%, respectively), that was so for only 19% of those 65 and older.
There was little difference in the economic status of Asian men and women in 2022. About equal shares of both lived in lower-, middle- and upper-income households in 2022.
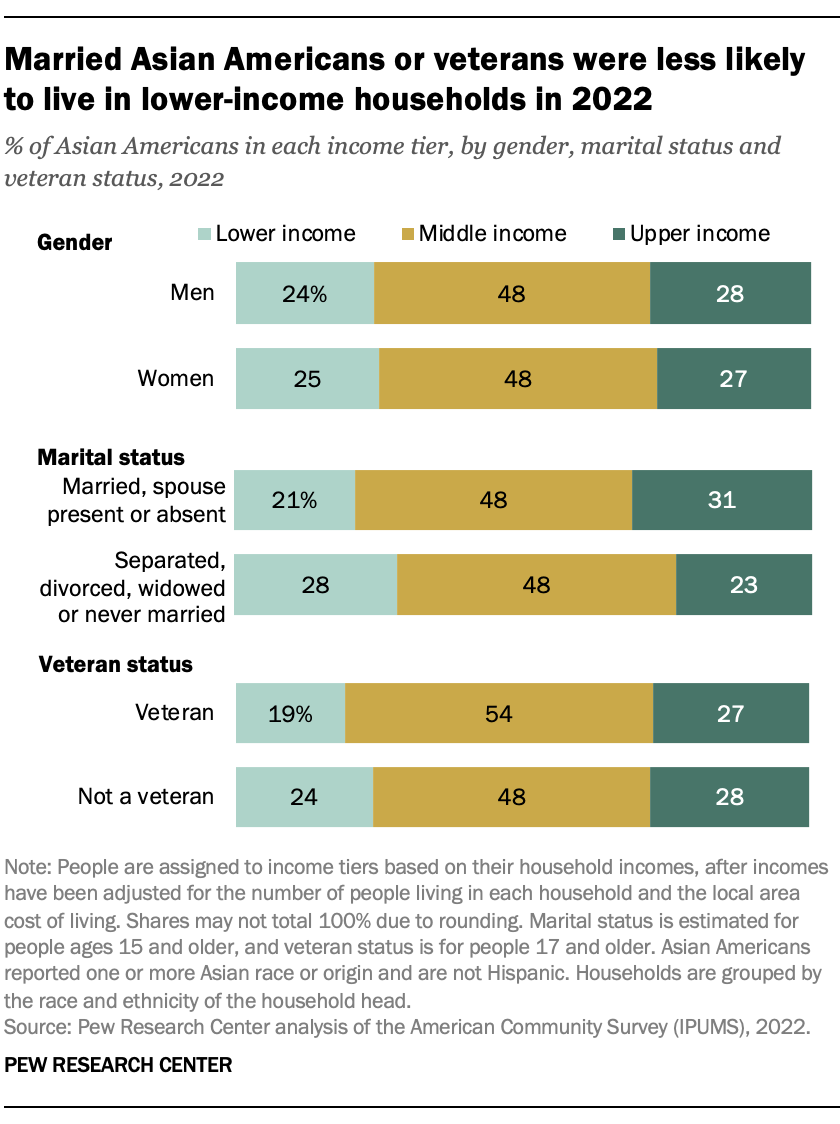
Marriage is associated with a move into the upper-income tier for Asian Americans. Among married Asian Americans, nearly a third (31%) were in the upper-income tier and 21% were lower income in 2022. In contrast, only 23% of Asian Americans who were separated, divorced, widowed or never married were in the upper-income tier, and 28% lived in lower-income households.
Asian veterans were less likely than nonveterans to be in the lower-income tier in 2022, 19% vs. 24%, respectively. The share of veterans in the middle class (54%) was also greater than the share among nonveterans (48%).
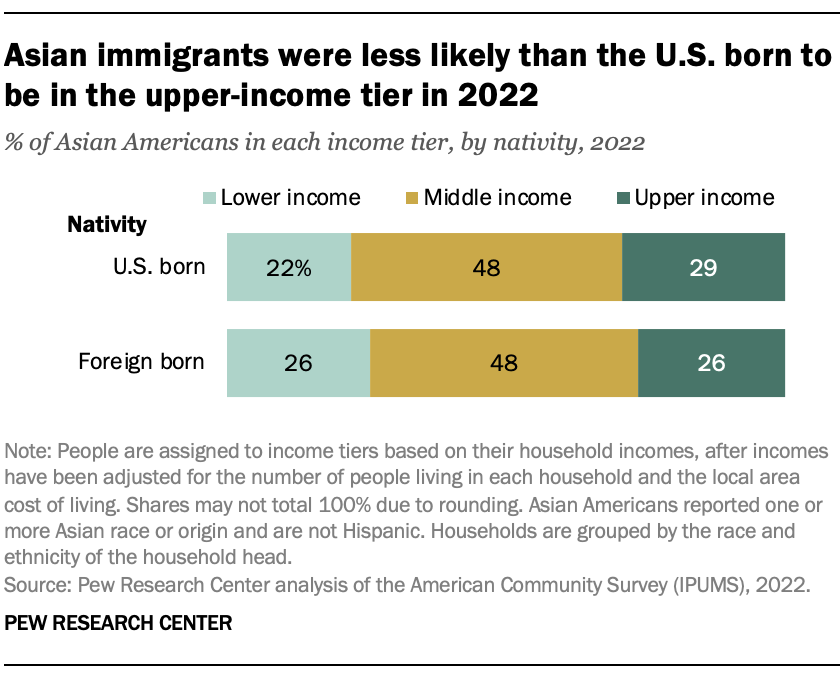
Among Asian Americans, immigrants were a bit less likely than the U.S. born to be in the upper-income tier and slightly more likely to be in the lower-income tier. In 2022, equal shares (48%) of Asian immigrants and the U.S. born were in the middle class. Some 26% of Asian immigrants were in the lower-income tier compared with 22% of the U.S. born.
Meanwhile, the share of U.S.-born Asian Americans in the upper-income tier (29%) edged out the share of immigrants in that tier (26%).
Asian American immigrants accounted for 65% of the overall Asian American population in 2022.
Asian Americans with a bachelor’s degree or higher level of education were much more likely to live in upper-income households. In 2022, 41% of Asian Americans ages 25 and older with at least a bachelor’s degree were in the upper-income tier, compared with 16% or fewer among Asians without a bachelors’ degree.
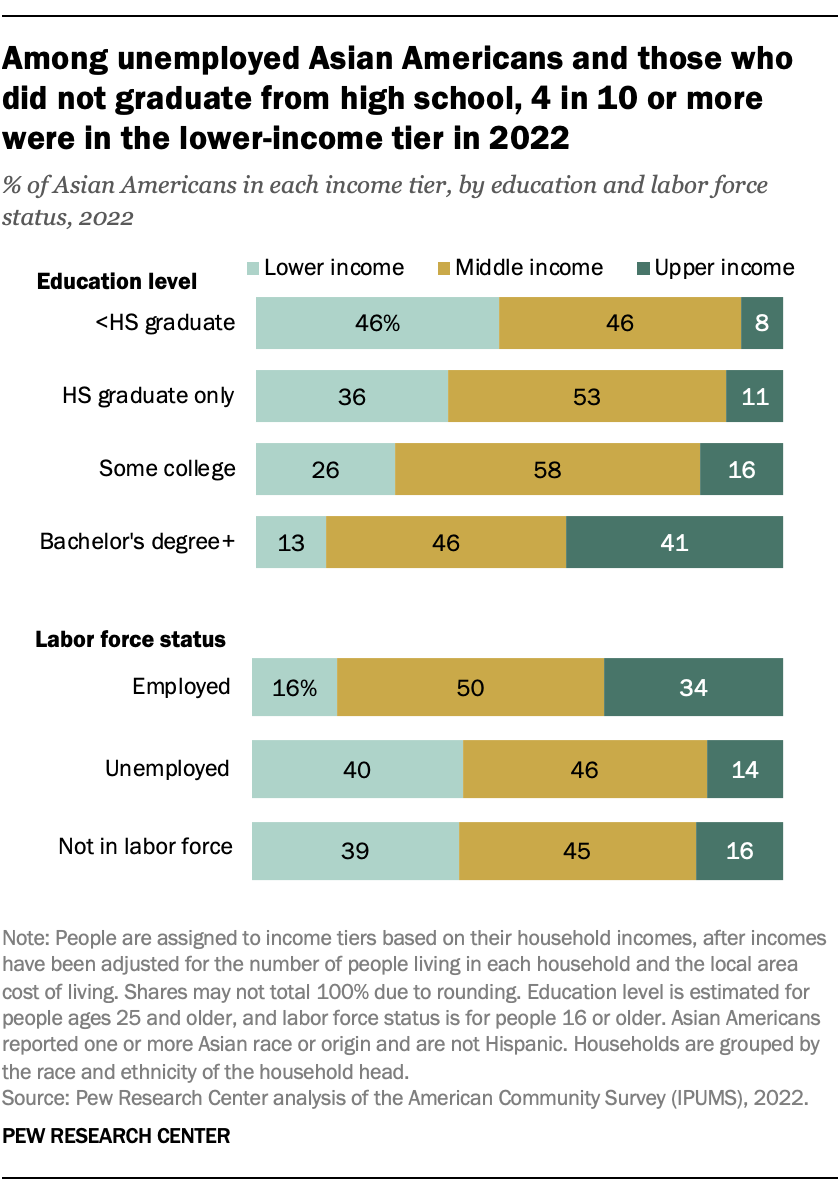
The share of Asian Americans in the middle class ranged from 46% among those who did not graduate from high school or had a bachelor’s degree to 58% among those with some college education. But only 13% of Asian Americans with a bachelor’s degree lived in lower-income households in 2022, compared with 46% among those without a high school diploma.
Not surprisingly, employment is critical for moving up the income ladder. Among employed Asian workers ages 16 and older, 50% were in the middle-income tier in 2022 and 34% were in the upper-income tier. Only 16% of employed Asian workers were lower income, compared with 40% of the unemployed.
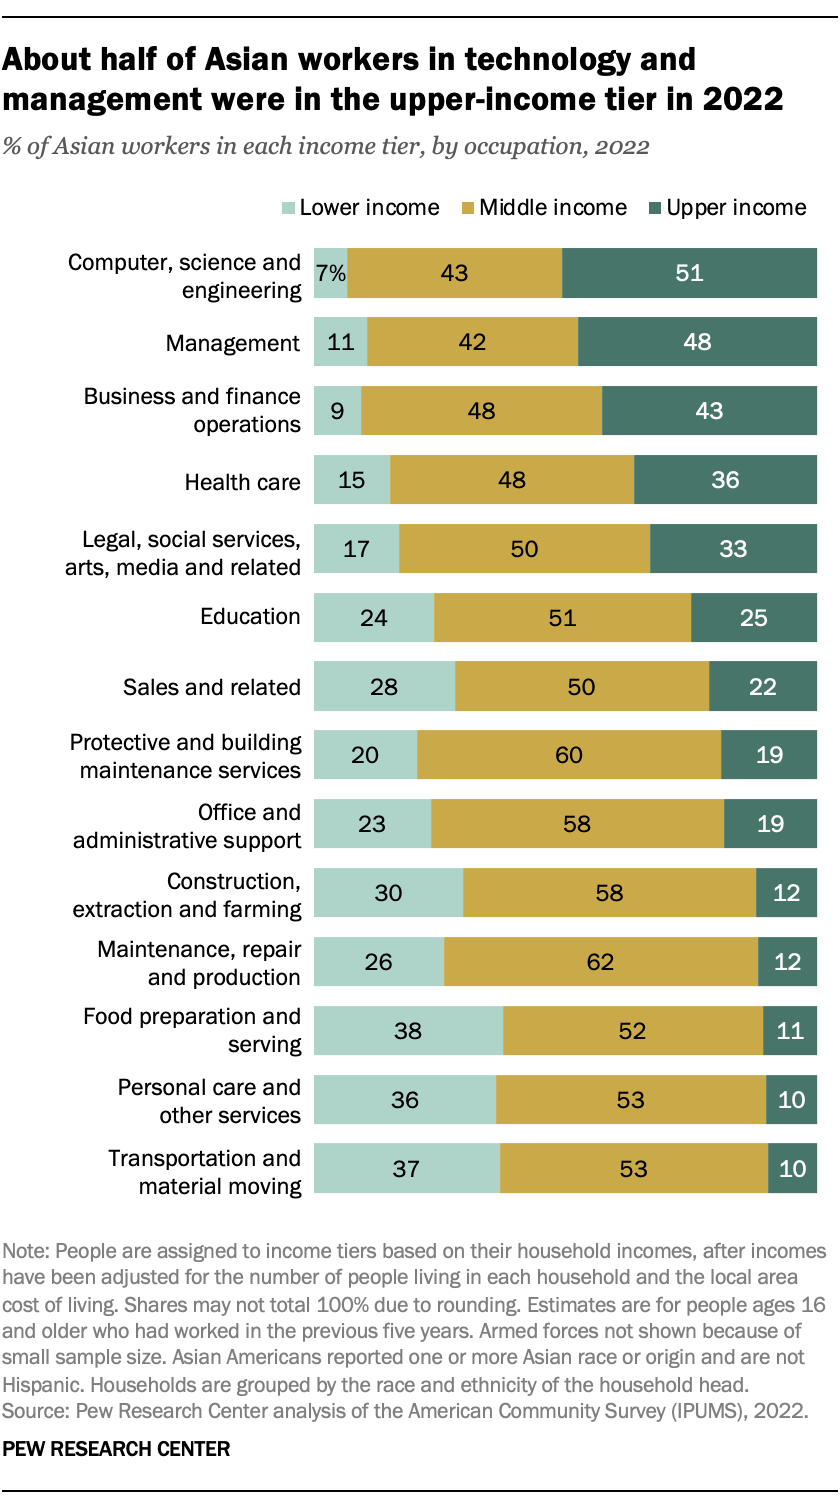
About half of Asian workers in computer, science and engineering (51%) or management occupations (48%) were in the upper-income tier in 2022, while only about one-in-ten or fewer were lower income. About a third or more of Asian workers in business and finance (43%), health care (36%) or legal and related occupations (33%) were also in the upper-income tier.
On the other hand, similar shares of Asian workers in occupations involving food preparation and serving (38%), personal care and other services (36%) and transportation and material moving (37%) were in the lower-income tier in 2022. Only about one-in-ten of these Asian workers were upper income.
About six-in-ten Asian workers in construction, extraction and farming (58%) or those providing protective and building maintenance (60%), office and administrative (58%), or maintenance, repair and production services (62%) were in the middle class in 2022.
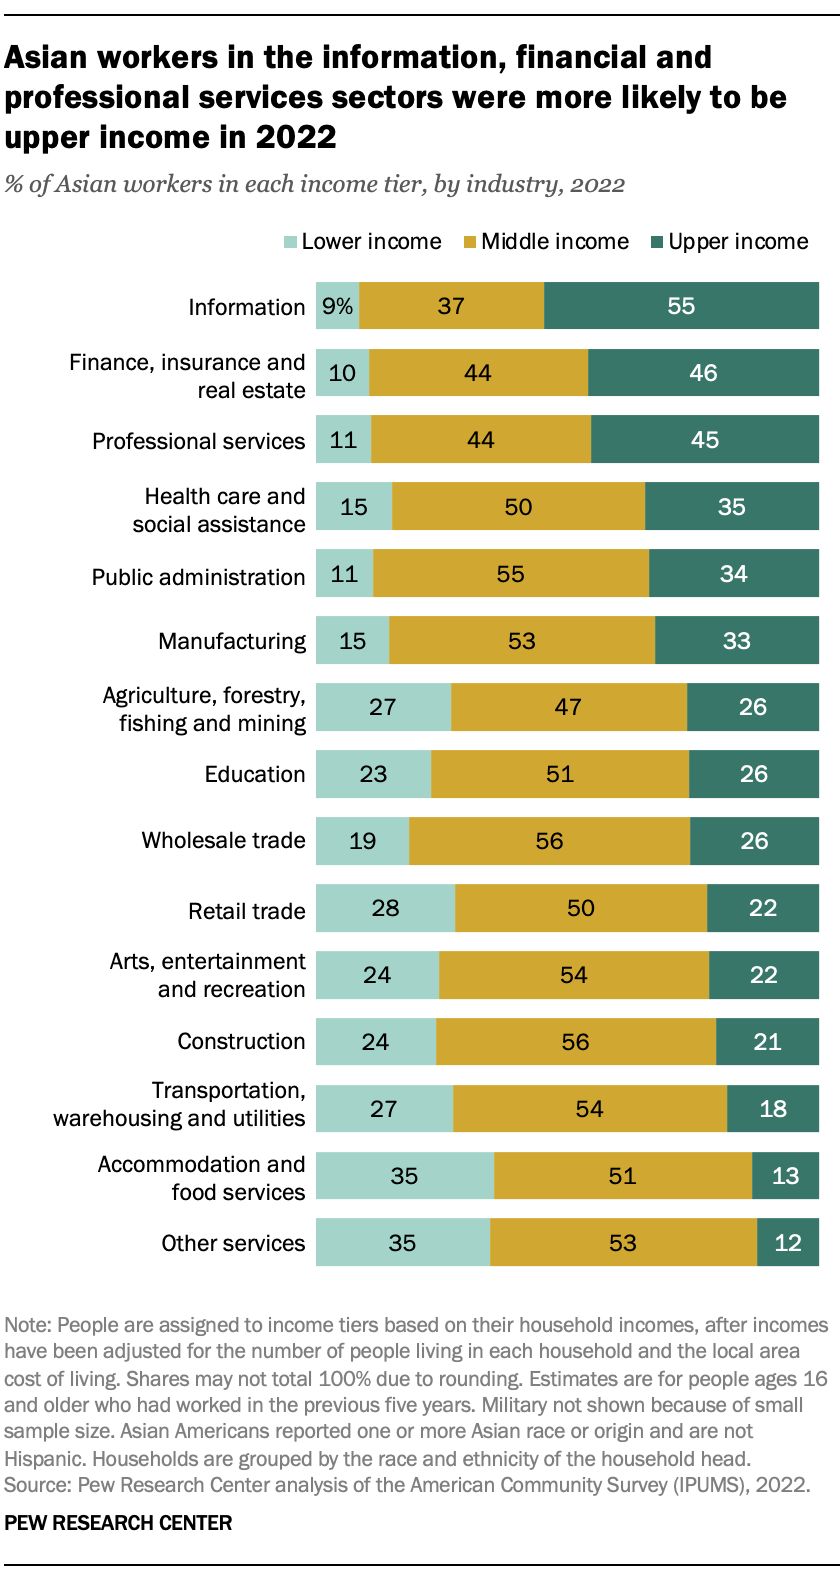
Some 55% of Asian workers in the information sector, 46% in the financial services sector and 45% in the professional services sector were in the upper-income tier in 2022. In these sectors, only about one-in-ten Asian workers were in the lower-income tier. More than eight-in-ten Asian workers in the health care and social assistance, public administration, or manufacturing sectors were in either the middle class or in the upper-income tier in 2022.
Accommodation and food services and the other services sectors are the only industries in which about a third or more of Asian workers were in the lower-income tier in 2022.
The share of Asian Americans who are in the middle class or in the upper- or lower-income tiers differs across U.S. metropolitan areas. But there seems to be little pattern to which metro areas have the highest shares of Asians in each income tier. (We first adjust household incomes for differences in the cost of living across areas.)
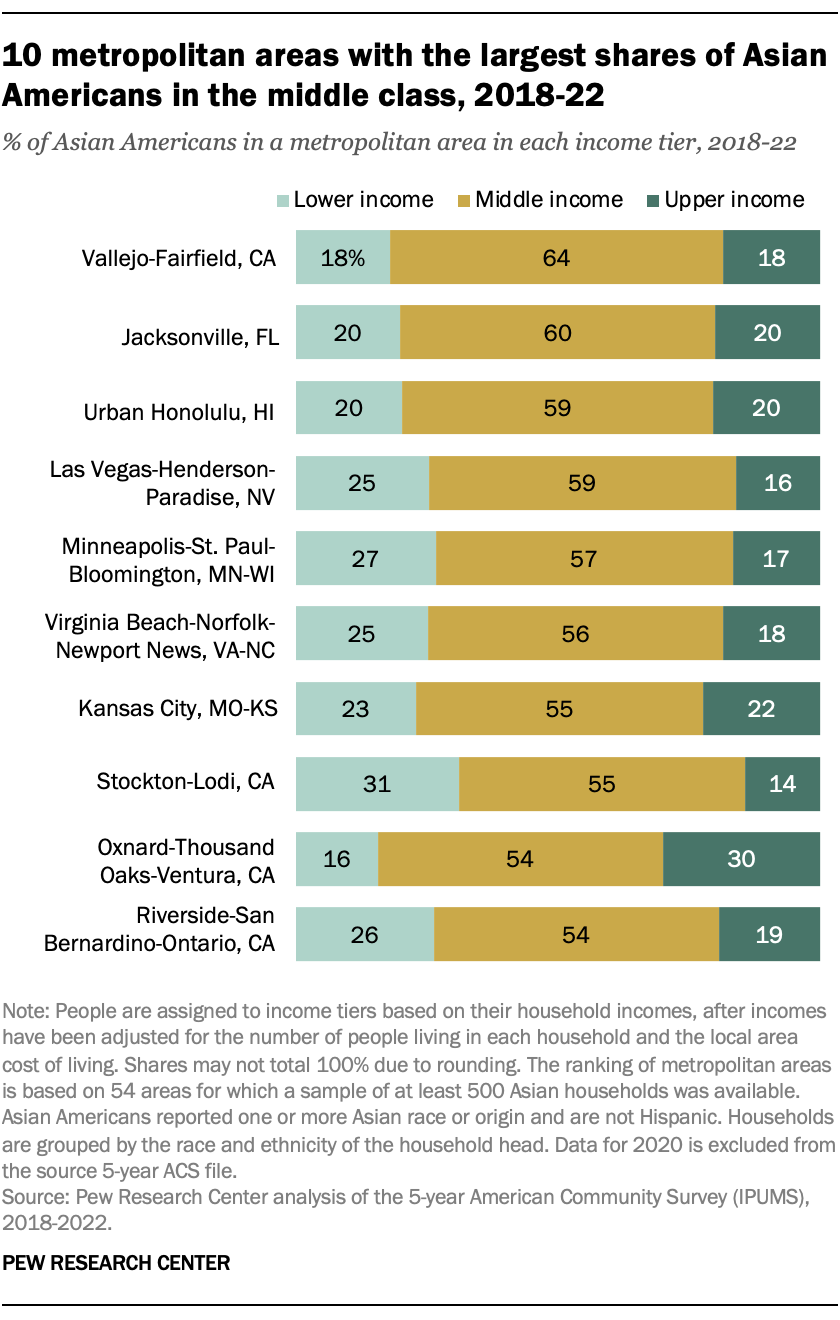
Most of the 10 metropolitan areas with the greatest shares of Asian Americans who are middle income are in coastal states. These areas include Honolulu to the west, where 59% of Asian Americans were in the middle class, and Virginia Beach-Norfolk-Newport News (in Virginia and North Carolina) to the east, where 56% were in the middle class over the period from 2018 to 2022. In Vallejo-Fairfield, near San Francisco, 64% of Asian Americans were in the middle class and 18% each were in the lower- or upper-income tier.
But in several of these 10 metro areas – such as Stockton-Lodi, California, and Minneapolis-St. Paul-Bloomington, which includes part of Wisconsin – about a quarter to a third of Asian Americans were in the lower-income tier from 2018 to 2022.
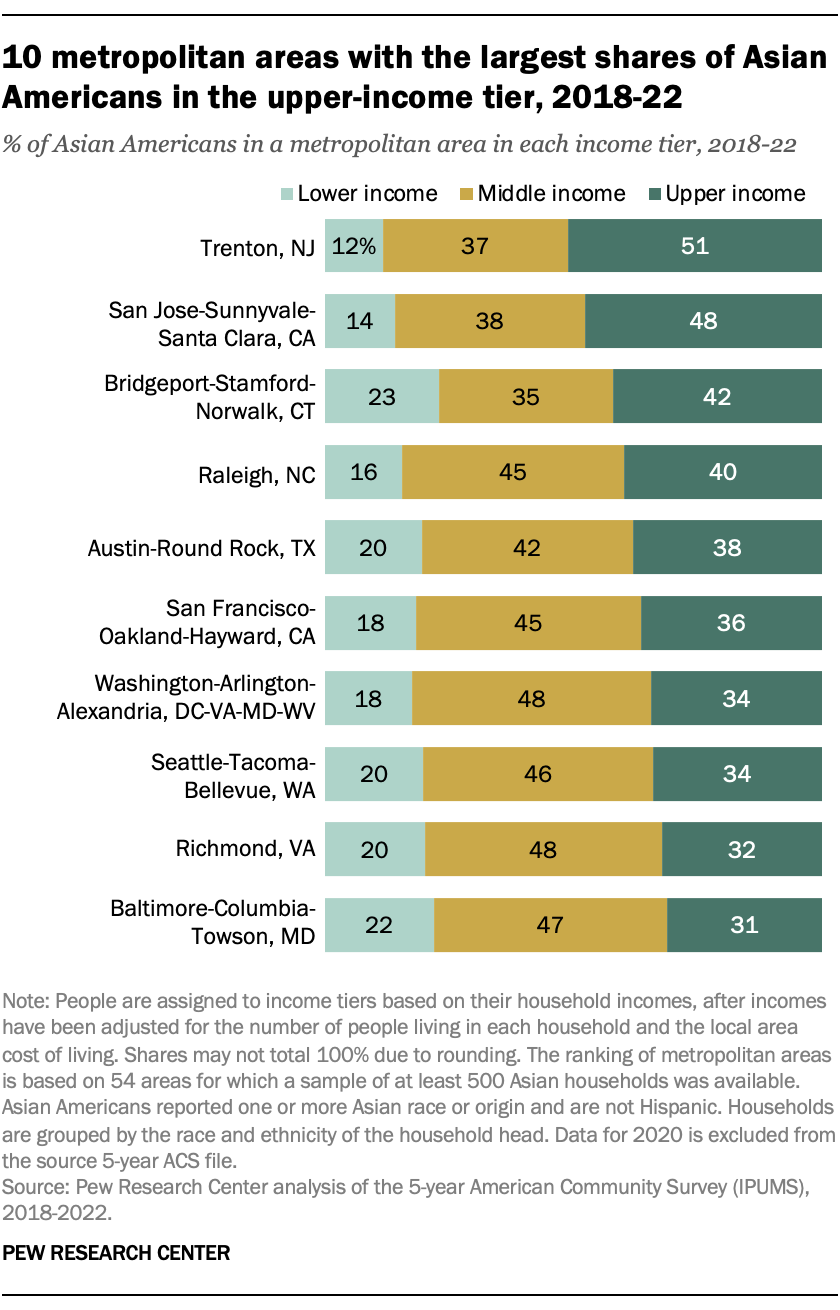
Several of the 10 U.S. metropolitan areas with the highest shares of Asian upper-income residents have technology-driven economies, as is the pattern for Americans overall. This group includes San Jose-Sunnyvale-Santa Clara, California, in which 48% of Asian Americans lived in upper-income households over the 2018-2022 period.
Other tech-driven areas on this list include Raleigh, North Carolina; Austin-Round Rock, Texas; San Francisco-Oakland-Hayward; and Seattle-Tacoma-Bellevue. Bridgeport-Stamford-Norwalk, Connecticut, is a financial hub.
Many of these areas are also home to major universities, research institutions and government centers, such as Trenton, New Jersey; Washington, D.C.-Arlington-Alexandria; and Baltimore-Columbia-Towson.
Overall, about a third to half of Asian Americans in these 10 metro areas were in the upper-income tier in the period from 2018 to 2022, and about one-in-five or fewer were lower income.
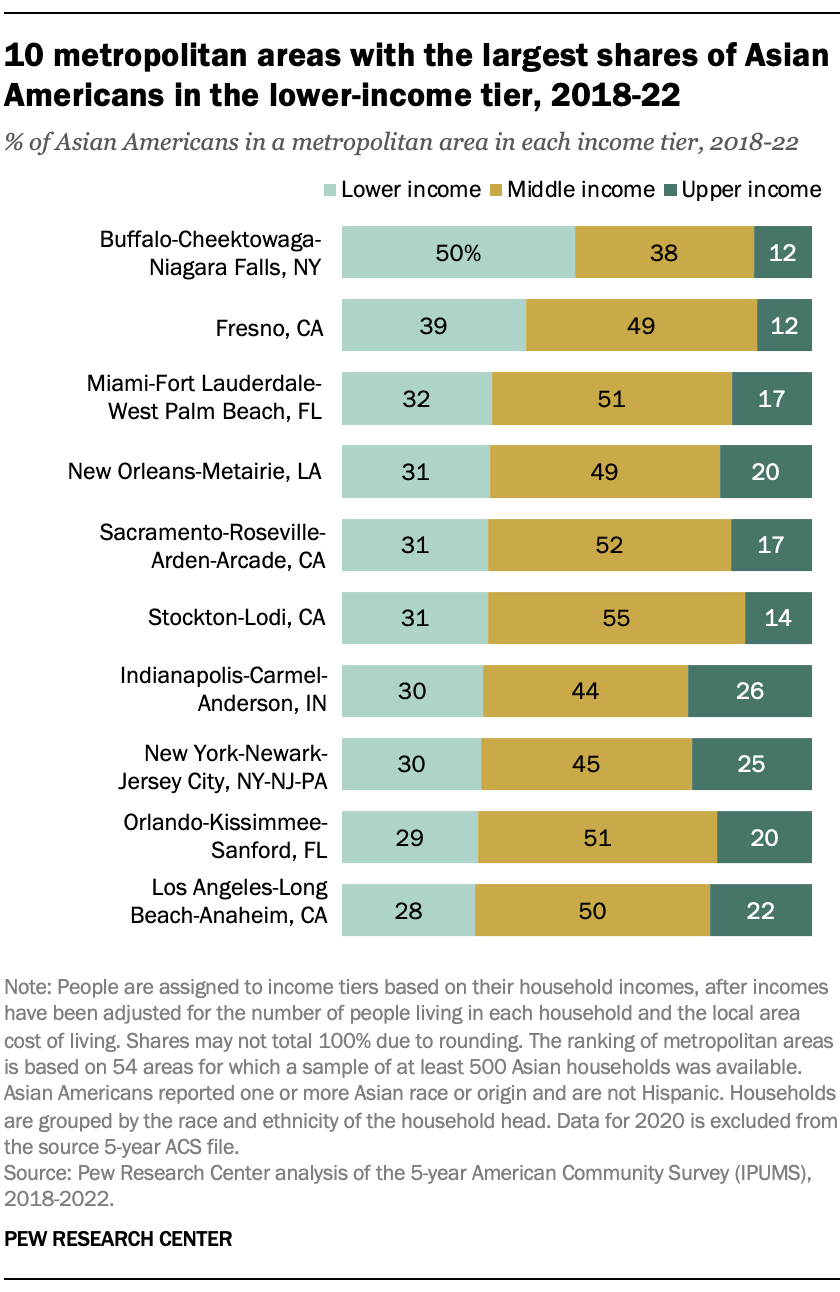
The 10 U.S. metropolitan areas with the highest shares of Asian lower-income residents include some of the nation’s most populous. From 2018 to 2022, 28% of Asian Americans in Los Angeles-Long Beach-Anaheim were in the lower-income tier, along with 30% of Asian residents in New York-Newark-Jersey City and 32% in Miami-Fort Lauderdale-West Palm Beach.
Buffalo-Cheektowaga-Niagara Falls, New York – where 50% of Asian Americans lived in the lower-income tier over the 2018 to 2022 period – stands out from the rest.
In several of these areas, such as Stockton-Lodi, about half or more of Asian residents were in the middle class over the 2018-2022 period.
It’s important to note that because of sample size limitations, we were only able to study the economic status of Asian Americans in 54 out of about 280 metro areas identified in the source data.
Note: For details on how this analysis was conducted, refer to the methodology.


