Exit polls show that the religious divide that has come to characterize American politics persisted in the 2006 election; white evangelicals and those who attend church frequently continued to support Republicans by large margins, while secular voters and infrequent churchgoers were similarly lopsided in their support of Democrats. But a survey by the Pew Research Center for the People & the Press, conducted in the days immediately following the election, suggests that Americans across a number of different religious groups had fairly positive reactions to the election.
Exit Poll Results – The “God Gap” Widens
In recent years, some have asked whether the Democratic Party has a serious “God problem” – an inability to appeal to evangelicals and other highly religious Americans. But the results of this year’s election raise the parallel question of whether the Republican Party can appeal to non-Christians and less religious voters. Exit polls find that the Democrats’ gains were concentrated among non-Christians and secular voters, indicating an even larger political divide between highly religious voters and the rest of American society.
The GOP held on to voters who attend religious services more than once a week, 60% of whom voted Republican compared with 61% in 2002. A majority (53%) of those who attend church at least once a week also supported Republicans. But less frequent churchgoers were much more supportive of Democrats than they were four years ago. Among those who attend church a few times a year, for instance, 60% voted Democratic, compared with 50% in 2002. And among those who never go to church, 67% voted Democratic; four years ago, only 55% did so. As a result, the gap in Democratic support between those who attend church more than once a week and those who never attend church has grown from 18 percentage points in 2002 to 29 points today.
Congressional Vote (House) by Worship Attendance, 2002-2006 (Share of 2006 Electorate in Parentheses)

Sources: 2006, 2004 and 2002 exit polls
Though white evangelical voters have been the bedrock of the GOP throughout this decade, many wondered in the days leading up to the election if the party’s troubles this year would hurt their prospects with this key voter group. But the GOP actually did very well among white evangelicals in 2006: 72% voted Republican in races for the U.S. House nationwide, and they gave strong support — about two-thirds or more — to Republican Senate candidates in several key states, including Tennessee, Pennsylvania, Ohio, Missouri and Virginia. These levels of support are comparable to those registered by evangelicals in 2004, when approximately 75% voted for Republican congressional candidates.
Congressional Vote by Religious Affiliation and Frequency of Religious Attendance, 2002-2006

Sources: Exit polls conducted by VNS (2002) and NEP (2004, 2006). Votes for other candidates not shown. *The 2002 exit poll did not include a measure of evangelical identification.
And, after see-sawing all year in the polls, President Bush’s approval rating among evangelicals on Election Day was 70%, far higher than among the electorate as a whole. Though that was down 10 points from its level two years earlier, the decline was no greater among evangelicals than among the rest of the electorate.
Evangelicals generally mirrored the rest of the public in the importance they attached to several key issues: Iraq, the economy and corruption and scandals. But while other voters who said corruption was extremely important voted heavily for Democratic candidates, exit polls reveal that two-thirds of white evangelicals who cited corruption voted for Republicans.
Evangelicals split from other voters in the very high level of importance they attached to values issues such as gay marriage and abortion: 59% said these issues were “extremely important” to their vote, compared with just 29% for other voters.
Among another key religious group – Catholics – the House vote divided much as it did in the last midterm election in 2002. The Democrats captured 55% of the Catholic vote, compared with 44% for the Republicans. The Democratic advantage was aided by a strong 75%-24% margin among Hispanic Catholics. But among white Catholics, a key swing voter group, Democrats and Republicans divided the vote almost evenly (50% versus 49%). Though Democrats did see an increase in support from white Catholics compared with 2004 (from 45% to 50%), these results represented virtually no gain for Democrats compared with 2002, when white Catholics also split their vote (48% Democratic, 49% Republican).
The exit polls clearly show that the Democrats’ gains in 2006 came largely among non-Christians and secular voters. House Democratic candidates gained 25 points among Jews and 7 points among those of other non-Christian faiths, compared with 2002. They also picked up 10 points among the much larger group of secular voters.
Pew Post-Election Survey
Though religious differences in vote choice persisted in 2006, people in most religious groups say they are happy that the Democrats won, they expect the party to be successful and, with the exception of white evangelical Protestants, they favor giving the party considerable latitude to pursue its agenda.
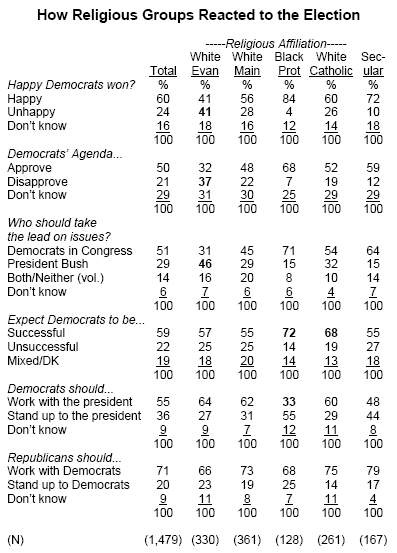
A post-election survey by the Pew Research Center for the People & the Press, conducted Nov. 9-12 among 1,479 Americans, found that all major religious communities want the Republican Party to try to work with Democratic leaders, even if it means disappointing some of their supporters. At the same time, all religious groups except black Protestants say that Democratic leaders should try to work with President Bush to get things accomplished. Only a third of black Protestants share this view.
Election Reactions
Most Americans (60%) – including majorities of white mainline Protestants (56%), black Protestants (84%), white Catholics (60%) and seculars (72%) — say they are happy that the Democrats won the election. Only among white evangelicals did as many express unhappiness as happiness with the Democrats’ victory (41% each).
Similarly, by a 50%-21% margin, Americans say they approve of Democratic congressional leaders’ policies and plans for the future. Nearly half of white mainline Protestants (48%) and majorities of black Protestants, white Catholics and seculars express approval of the Democratic agenda. White evangelicals express much lower approval for the Democrats’ plans, but nearly as many evangelicals express approval (32%) as disapproval (37%). And majorities of all religious groups, including 57% of evangelicals, expect the Democrats to be successful in getting their programs passed into law.
Majorities of black Protestants, white Catholics and seculars, along with a plurality of white mainline Protestants, say that Democratic congressional leaders, rather than President Bush, should take the lead in solving the nation’s problems. Only among white evangelicals do those saying President Bush should take the lead (46%) outnumber those who favor seeing Democrats lead the way (31%).
But regardless of who they think should take the lead in Washington, majorities of all religious groups (including 66% of white evangelicals) say that Republicans should try as best they can to work with Democrats to accomplish things, rather than standing up to Democrats on the issues. Likewise, majorities of white religious groups and a plurality of seculars say that Democrats should try their best to work with President Bush, rather than stand up to him on the issues. Only among black Protestants does a majority (55%) favor standing up to the president rather than cooperating.
Views of the Parties
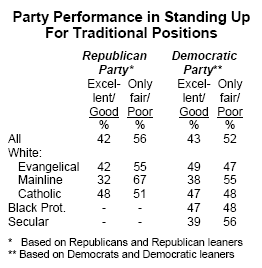
Pluralities or majorities of partisans within nearly all major religious groups rate their own party more negatively than positively. Among Republicans and Republican-leaning independents, 56% overall say the party is doing only a fair or poor job standing up for its traditional positions on things like reducing the size of government, cutting taxes or promoting conservative social values; just 42% say the party is doing an excellent or good job. White evangelicals rated the party about the same as other Republicans — neither more positively nor more negatively. White mainline Protestants, however, were considerably more negative about the GOP than other religious groups, with 67% rating the party’s performance as fair or poor.
On the Democratic side, the differences across religious groups were more modest. Black Protestants, a key part of the Democratic coalition, were divided in their views about the performance of the party: 47% said the party was doing an excellent or good job, while 48% said it was doing only a fair or poor job; white evangelicals and white Catholics were similarly divided.
Issue Priorities in 2006
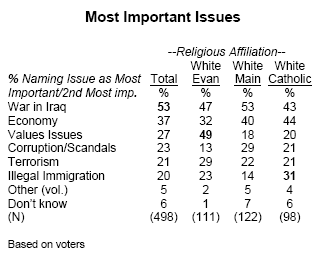
As described above, Election Day exit polls revealed that most Americans viewed a variety of issues as important in the election. But Pew’s post-election survey, which asked Americans to identify which issue was most important in their voting decision, finds that Iraq was the central issue of the campaign. Indeed, a majority of voters saw the Iraq war as one of the top two issues in the election (53%), with the economy second (37%), followed by values issues such as abortion and marriage (27%). About one-fifth of the voters gave priority to corruption and scandal (23%), terrorism (21%) and illegal immigration (20%).
However, issue priorities differed across the major religious communities. White evangelical voters put values issues at the top of their agenda (49%), slightly ahead of the Iraq war (47%), with the economy third (32%). Fewer than one-in-six mentioned corruption and scandals.
By contrast, white mainline Protestants fell close to the national average, with most naming the Iraq war (53%), followed by the economy (40%) and corruption (29%). White Catholics showed yet another pattern, with comparable numbers naming the economy and Iraq as their top issues, followed by illegal immigration (31%).
Election Information in the Church
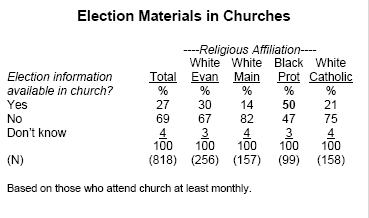
Among Americans who reported attending religious services at least monthly, nearly three-in-ten (27%) say that information about political parties or candidates in the recent election was available at their place of worship in 2006. Among those who said they voted in the election, 22% reported that election information was made available at church – a higher proportion than in the presidential election of 2000 (14%) but not as high as in 1996 (28%).
Half of the black Protestants (50%) said that information about the elections was made available at their churches; nearly one-third (30%) of white evangelicals also reported this. Fewer white Catholics (21%) and mainline Protestants (14%) said they were exposed to political information through their churches.
Very few respondents said that they were encouraged to vote a particular way by clergy or other religious groups, however. Just 7% of churchgoing voters said they had been urged to vote for particular candidates or parties; 4% recalled being urged to vote Republican, 1% Democratic and 2% could not remember for whom they were encouraged to vote. This was comparable to elections in 2000 and 1996.
A Look Ahead: 2008 Presidential Candidates
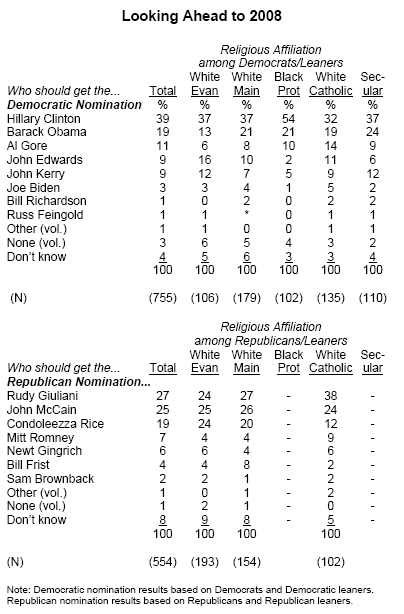
Relatively few religious differences are seen as yet in voter preferences for presidential candidates in 2008. Across all religious groups, Sen. Hillary Clinton receives at least plurality support among all Democrats and Democratic-leaners, including a majority among black Protestants (54%). Sen. Barack Obama is a distant second among Democrats and leaners, with 19% support. Among black Protestants, Obama receives as much support as he does among other religious groups (21%), but he still trails Clinton by more than 30 points. Indeed, Obama was second among all groups except white evangelicals, among whom former Sen. John Edwards claimed the second spot with 16%.
Among Republicans and Republican-leaners, former New York Mayor Rudy Giuliani and Sen. John McCain are tied for the top spot among white mainline and white evangelical Protestants. But Giuliani leads McCain among white Catholics by 38%-24%. Secretary of State Condoleezza Rice receives a similar level of support among white evangelicals (24%) as Giuliani and McCain, but she trails both among white Catholics, with 12% support.
Note: This report is a compilation of findings from two previous Pew Research Center analyses: “Election ’06: Big Changes in Some Key Groups,” by Scott Keeter, and “Religious Groups View the 2006 Election,” by Greg Smith, Scott Keeter and John Green. For the full report on the Pew Research Center post-election survey, see pewresearch.org/pewresearch-org/politics.