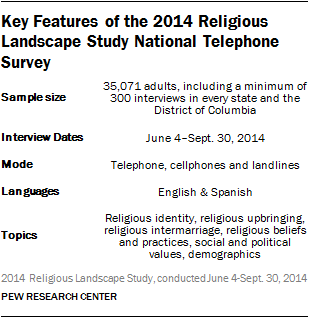
The centerpiece of Pew Research Center’s 2014 Religious Landscape Study is a nationally representative telephone survey conducted June 4-Sept. 30, 2014, among a sample of 35,071 U.S. adults. Approximately 60% of the interviews were conducted with respondents reached on cellphones (n=21,160) and 40% were completed on landlines (n=13,911). A minimum of 300 interviews were conducted in every state and the District of Columbia. Interviewing was conducted in English and Spanish. The survey is estimated to cover 97% of the non-institutionalized U.S. adult population; 3% of U.S. adults are not reachable by telephone or do not speak English or Spanish well enough to participate in the survey. No adjustments have been made to the survey’s estimates of the religious composition of the U.S. population to attempt to account for the small amount of non-coverage.
Data collection was divided equally among three research firms – Abt SRBI, Princeton Survey Research Associates International (PSRAI) and Social Science Research Solutions (SSRS). Abt SRBI served as the lead research firm coordinating the data collection, providing the sampling plan and producing the survey weights. Both the landline and cellphone samples were provided by Marketing Systems Group (MSG).
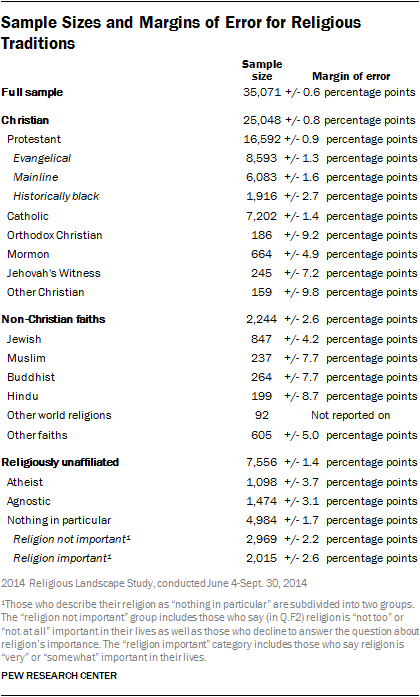
The size of the national sample is unusually large for a religion survey. There are two main reasons for this. First, the large sample size makes it possible to estimate the religious composition of the U.S. with a high degree of precision. After taking into account the survey’s design effect (based on the sample design and the survey weights), the margin of error for results based on the full sample is +/- 0.6 percentage points.
Second, the large sample size makes it possible to describe the demographic characteristics of a wide variety of religious groups, including relatively small groups that cannot be analyzed using data from smaller surveys. With more than 35,000 respondents in total, the Religious Landscape Study includes interviews with roughly 350 people in religious groups that account for just 1% of the U.S. population, and with 100 or more people in religious groups that are as small as three-tenths of 1% of the overall population. For instance, the study includes interviews with 245 Jehovah’s Witnesses, a group that accounts for less than 1% of the U.S. population and is typically represented by only a few dozen respondents in smaller surveys.
Sample Design
The national survey employed a dual-frame (cellphone and landline) random-digit dialing (RDD) approach to yield a nationally representative sample that included a minimum of 300 completed interviews in every state. This was accomplished by first allocating the total expected number of interviews (~35,000) to states in proportion to their respective share of the national adult population. At this stage, 16 states (including the District of Columbia) were identified in which the proportional allocation would result in fewer than 300 interviews. These 16 states were oversampled to obtain at least 300 interviews in each of them, while the remaining 35 states were undersampled proportionately. The weighting of the data (described below) ensures that all states are represented in their proper proportion in the national weighted estimates.
The allocation of sample to the landline or cellphone RDD frame was customized for each state to reflect state-level variation in telephone usage. The amount of sample allocated to cellphone numbers ranged from a low of 35% in Rhode Island to a high of 84% in Mississippi.
The landline sample was drawn from MSG’s 1+ assignment-assisted RDD sampling frame. The cellphone sample was also drawn by MSG, using their Cell-WINS activity flags. The Cell-WINS service appends activity code information to each sampled record, flagging it as active, inactive or “unknown.” In the initial cell sample, 59% of numbers were flagged as active, 40% were flagged as inactive and 1% were flagged as unknown. The cell sample was managed such that active and “unknown” numbers were oversampled while inactive numbers were undersampled. Oversampling cellphone numbers flagged as active or “unknown” helps to control survey costs by increasing the amount of interviewer time spent dialing eligible numbers. Retaining some numbers flagged as inactive ensures that the survey’s coverage rate was not affected. The weighting of the data corrects for the undersampling of flagged-inactive numbers so that they are represented in their proper proportion in the weighted estimates.
Interviewing
Sampled telephone numbers were called as many as seven times in an effort to obtain a completed interview. Numbers flagged as “callbacks” (i.e., numbers at which a respondent had begun the interview without completing the survey) were called back an additional two times during the final four weeks of the survey period. Refusal conversion was attempted in instances of soft refusals in both the landline and cellphone frames. Calls were staggered over times of day and days of the week to maximize the chance of making contact with potential respondents. Each number received at least one daytime call.
In the landline sample, interviewers asked to speak with the youngest adult at home at the time of the call. In the cellphone sample, interviews were conducted with the person who answered the phone provided the person was age 18 or older. Respondents reached on cellphones were offered a reimbursement of $5 for their cellphone minutes used participating in the survey.
In an effort to maximize the number of interviews with adults who primarily speak Spanish, the study utilized a special protocol in which sampled telephone numbers that service areas with sizable Hispanic populations were dialed by bilingual Spanish- and English-speaking interviewers. Two flags were created in each frame (landline and cellphone) to identify cases with a relatively high probability of requiring Spanish administration. In the landline RDD sample, the first flag identified telephone exchanges with an estimated Hispanic incidence of 65% or higher. In the cell frame, the first flag identified numbers that belonged to rate centers (i.e., billing centers) with an estimated Hispanic incidence of 70% or higher. These numbers were dialed exclusively by bilingual interviewers capable of conducting the interview in either English or Spanish. There was just one exception to this rule; respondents who completed part of the interview but did not finish the survey and who spoke English were eligible to be called back subsequently by interviewers who spoke only English.
Each frame (landline and cellphone) also included a second Hispanic incidence flag. The second flag in the landline sample identified exchanges with an estimated Hispanic incidence of 60% to 64.99%. The second flag in the cell frame identified numbers associated with rate centers with an estimated Hispanic incidence of 65% to 69.99%. In the event that the research firms that conducted the interviewing had bilingual interviewing capacity over and above that needed to dial numbers associated with the first flag, bilingual interviewers were then assigned to numbers identified with the second flag.
Ultimately, 3.8% of all interviews were conducted in Spanish, including 4.6% in the cellphone sample and 2.5% in the landline frame.
Weighting
National- and State-Level Weighting
The national- and state-level results included in this report are based on weighted estimates. The weighting was conducted in two stages. The first stage in the weighting produced base weights that account for several factors, including: 1) the probability of selection of the telephone number, computed separately for each of 102 sampling strata defined by the cross-classification of sample frame (landline and cellphone) and state (including the District of Columbia); 2) the oversampling of “active” numbers in the cell frame; 3) the within-household selection of one respondent per household in the landline frame; and 4) the overlap between the cell and landline frames.
The second stage of the weighting calibrated the base-weighted data to demographic benchmarks for the population covered by the survey. This was performed via iterative proportional fitting (or “raking”). The raking procedure aligned survey respondents to population benchmarks on the following dimensions within each state:
- Gender by age
- Gender by education level
- Education level by age
- Race/ethnicity
- Telephone service
- Region of state (except for the District of Columbia)
Most of the demographic weighting parameters came from the Census Bureau’s 2012 American Community Survey (ACS) one-year estimates, which was the most current data source available at the time the data were weighted. The ACS parameters were calculated for adults ages 18 and older residing in households in each state, excluding those living in institutionalized group quarters. The telephone service parameter for each state was constructed from model-based estimates released by the National Center for Health Statistics (NCHS) National Health Interview Survey (NHIS) for the year 2012. Since the cellphone-only adult population has increased every year since 2012, these state-level estimates were updated using 2013 NCHS data to reflect regional trends. The region parameter was specific to each state and was computed based on the 2012 ACS five-year estimates for adults living in each county in the U.S.
The distribution of the raked weights was examined separately for each state, and customized trimming was performed at the state level to prevent individual interviews from having too much influence on the final results and to reduce the variance of the weights at the state level. Finally, the weights for each state were scaled to correct for the oversampling of smaller states and the corresponding undersampling of larger states. This ensures that all states are represented in their proper proportion in the weighted estimates included in this report.
Metropolitan Area Weighting
In addition to providing estimates for the nation as a whole and for all 50 states and the District of Columbia, the national survey obtained interviews from 250 or more respondents in 22 of the nation’s largest Metropolitan Statistical Areas (MSAs): Atlanta, Baltimore, Boston, Chicago, Dallas, Detroit, Houston, Los Angeles, Miami, Minneapolis, New York City, Philadelphia, Phoenix, Pittsburgh, Providence, Riverside (Calif.), St. Louis, San Diego, San Francisco, Seattle, Tampa and the Washington, D.C., metro area (including the District of Columbia as well as parts of Maryland, Virginia and West Virginia).
Some MSAs span multiple states, which necessitated weighting each MSA separately. Like the national- and state-level weights, each MSA weight was calculated in two stages, beginning with the same first-stage (base) weight as in the national- and state-level weights. In the second stage, the base weight was adjusted for each MSA via raking to align survey respondents to population benchmarks on the following dimensions within each MSA:
- Gender by age
- Gender by education level
- Education level by age
- Race/ethnicity
- Telephone service
The demographic weighting parameters came from an analysis of the Census Bureau’s 2012 ACS five-year estimates, which was the most current data source available at the time the survey data were weighted. The ACS parameters were calculated for adults ages 18 and older residing in households in each MSA, excluding those living in institutionalized group quarters. The telephone service parameter was constructed from sub-state-level estimates released by the NCHS for the year 2012. Since the cellphone-only adult population has increased every year since 2012, these sub-state-level estimates were updated using 2013 NCHS data to reflect national trends.
Design Effect and Margins of Error
Weighting and survey design features that depart from simple random sampling (e.g., the oversampling of less populous states) tend to result in a loss of precision in survey estimates. This loss of precision, known as the design effect, is incorporated in all margins of error, standard errors and tests of statistical significance included in this report.
Generally speaking, larger sample sizes are associated with smaller margins of sampling error, and smaller sample sizes are associated with larger margins of error. The margin of error for national estimates from this survey is +/- 0.6 percentage points. The margins of error for subgroups are larger. The accompanying tables present sample sizes and corresponding margins of error for the religious traditions discussed throughout much of this report, as well as for each state and the MSAs analyzed here and online. Sample sizes and margins of error for other groups are available upon request.
In addition to sampling error, one should bear in mind that question wording and practical difficulties in conducting surveys can introduce error or bias into the findings of opinion polls. For example, in surveys like this one that are conducted in English and Spanish, estimates for religious groups with large numbers of people who speak other languages (e.g., Buddhists, Muslims and others) may be biased toward the English- and Spanish-speaking subsets of these populations.
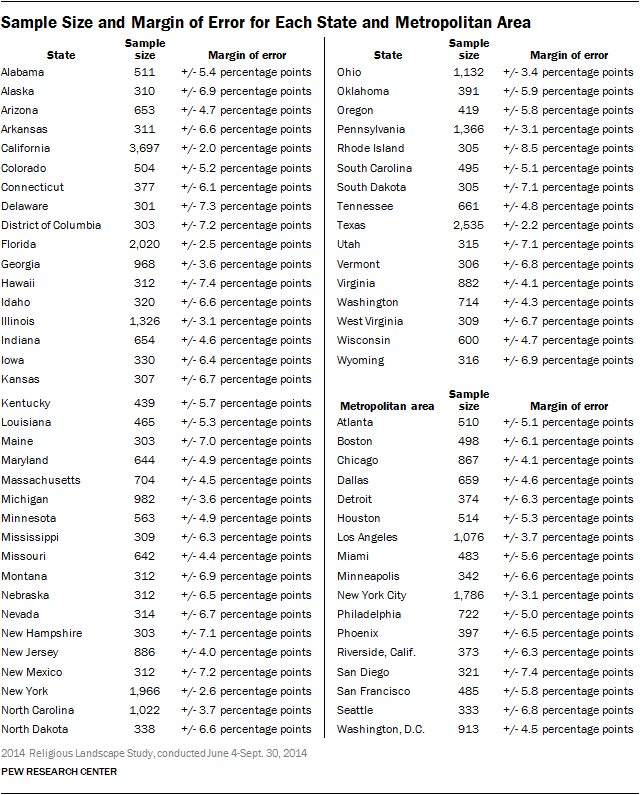
In addition to reporting on the characteristics of religious traditions and the religious composition of states and localities, this report and the accompanying interactive tool provide details on many other groups (e.g., men and women, immigrants and those born in the U.S., adherents of specific denominations such as the United Methodist Church and the Church of the Nazarene, etc.). Sample sizes for these groups vary widely; the survey includes interviews with 17,514 men and 17,557 women, but just 101 respondents who identify with the Church of the Nazarene. Sample sizes and margins of error for groups included in the detailed tables of the second Landscape Study report, “U.S. Public Becoming Less Religious,” can be found within the detailed tables as an additional aid.
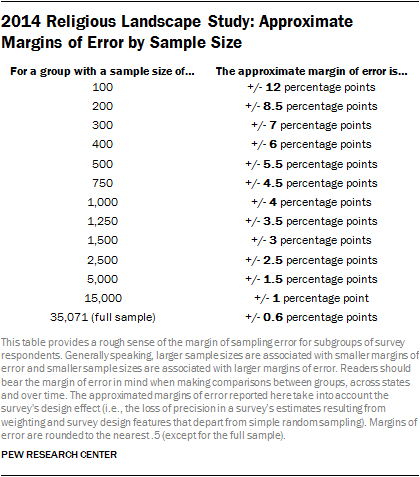
As an aid to help readers interpret the study’s findings, the accompanying table provides approximate margins of error for groups of varying sizes. The margin of error for results based on men (n=17,514), for example, is +/- 0.9 percentage points. By contrast, the margin of error for results based on those who identify with the Church of the Nazarene (n=101) is much larger (+/- 12 percentage points). Readers should always bear in mind the approximate margin of error for the group they are examining when making comparisons with other groups or assessing the significance of trends over time.
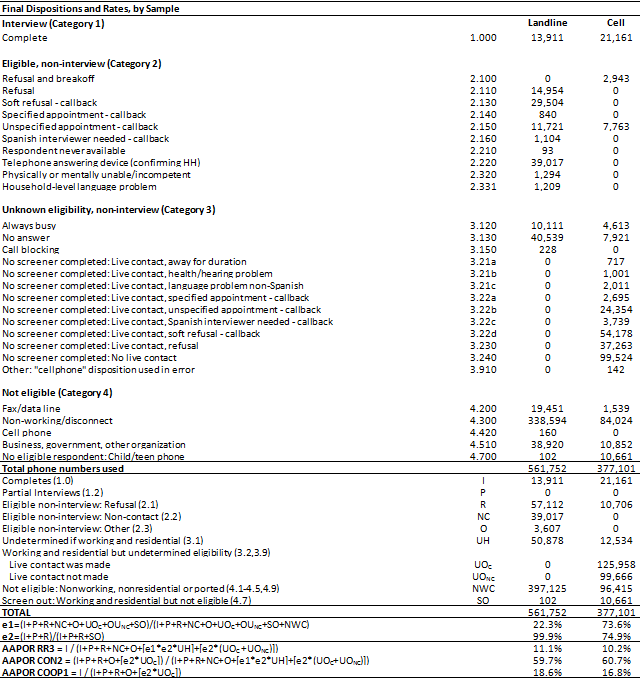
Sample Disposition and Response Rates
The table below reports the disposition of all sampled telephone numbers dialed for the survey. Overall, the response rate (AAPOR3) was 11.1% for the landline sample and 10.2% for the cell sample.
Comparisons Between 2007 and 2014
One key goal of the 2014 Religious Landscape Study is to make comparisons between the current study and the original Landscape Study conducted in 2007. As such, the 2014 study repeated many of the questions and retained many of the methodological features of the 2007 study. There are, however, a few differences between the two studies worth noting.
First, though the two studies employed the same questions to categorize respondents into religious traditions, there are a few small religious groups that are categorized differently in 2014 than in 2007. For example:
- Jains were counted as Hindus in 2007 but are included in the “other world religions” tradition in 2014. Jains account for less than one-tenth of 1% of 2014 respondents.
- Those identifying with the Self Realization Fellowship were included in the “other world religions” tradition in 2007 but are counted as Hindus in 2014. They account for less than one-tenth of 1% of 2014 respondents.
- Those identifying with the New Thought movement were included in the New Age family in the “other faiths” tradition in 2007. In 2014, they are included in the Metaphysical family in the “other Christian” tradition. They account for less than one-tenth of 1% of 2014 respondents.
These small changes have no substantive impact on the interpretation of trends between the 2007 and 2014 survey.
Second, the 2014 study was conducted in all 50 states and the District of Columbia. Though the 2007 study included follow-up surveys in Alaska and Hawaii, the national estimates from the 2007 survey are based on interviews conducted in the 48 continental states and the District of Columbia. Analysis of the data shows that this change has no substantive impact on the interpretation of trends between the 2007 and 2014 survey.
Third, the 2007 survey was conducted only on landlines, whereas the 2014 study was conducted on landlines and cellphones. In 2007, roughly 14% of U.S. adults were cellphone-only (i.e., reachable on a cellphone but not by a landline telephone), and landline-only surveys were still a viable means by which to survey a nationally representative sample of the population. By 2014, it was no longer possible to conduct nationally representative surveys using only landlines, as the cellphone-only share of the population had grown to 43%.25
Though the 2007 survey was conducted only on landlines, it also included an experimental component in which 500 cellphone-only respondents were interviewed, facilitating a comparison of the 2007 estimates both with and without cellphones included. That analysis showed that estimates of the religious composition of the U.S. were the same when cellphones were included and when they were not. As a result, this change in methodology is not expected to have a meaningful impact on the interpretation of trends between the 2007 and 2014 survey.
Furthermore, Pew Research Center political polls have been conducted on landlines and cellphones since 2008. Those polls typically include one question about religious identity, and they show a similar pattern in recent years to that observed in the Religious Landscape Study, with more Americans identifying as religious “nones” and fewer identifying as Protestants and Catholics. See Appendix C of the first Landscape Study report, “America’s Changing Religious Landscape,” for more details.
Fourth, the 2014 Religious Landscape Study was intended to document the religious composition of each of the 50 states in addition to the nation as a whole. To accomplish this, the sampling plan was designed to achieve a minimum of 300 interviews in every state, and the data for each state were weighted to demographic benchmarks derived from the U.S. Census Bureau and other government sources. The state in which respondents reside is determined by their self-reported ZIP code. By contrast, the 2007 study was not designed to yield a minimum number of interviews in every state and the 2007 data were not weighted to state-level demographic benchmarks. And in the 2007 study (which was conducted only on landlines), the state in which respondents reside was determined by their telephone number. Despite these differences, analysis of the 2007 state-level data indicates that the 2014 state-level results can safely be compared to the 2007 study.26 Information on the religious composition of each state (and major metropolitan areas) is available in the detailed tables in Appendix D of the first Landscape Study report, “America’s Changing Religious Landscape,” and online through a new interactive tool.
Fifth, in an effort to increase the number of interviews conducted with Orthodox Christians, Buddhists and Hindus, the 2007 study called back respondents from a previous study who identified with those groups. The 2014 study includes only respondents who were contacted for the first time as part of the 2014 Religious Landscape Study. As a result, trends among these groups should be interpreted with caution. Additionally, the data suggest that Asian Americans interviewed as part of this and other studies conducted in English and Spanish may include a disproportionately large number of young Asian-American adults. Those who are interested specifically in the religious beliefs and practices of Buddhists and Hindus should consult findings from Pew Research Center’s 2012 survey of Asian Americans, which was conducted in English as well as seven Asian languages and which includes interviews with more Asian-American Buddhists and Hindus than does the Landscape Study.


