This appendix aims to put the findings from the Religious Landscape Study into a broader context through a comparison of its results with long-term trends from the General Social Survey (GSS), Gallup Organization surveys and results from ongoing polls conducted monthly by Pew Research Center. Generally, these sources indicate that there is a fair amount of stability in American religion, but also several signs of decline, albeit at a gradual pace. As Mark Chaves, summarizing GSS trends since the 1970s, puts it, “there is much continuity, and there is some decline, but no traditional religious belief or practice has increased in recent decades” (emphasis is the author’s).17
The ideal way to make comparisons across data sources is to examine topics that have been asked about in exactly the same way. But the Landscape Studies, GSS and Gallup surveys have not always measured the same religious beliefs and behaviors, nor have they asked about them using identical questions. Partly as a result, the three sources examined here sometimes produce varying estimates of the share of the population that espouses a particular religious belief or engages in a particular religious practice. This analysis focuses primarily on assessing similarities and differences in the direction of trends in American religion more than estimates of the prevalence of particular religious characteristics, which can vary based on differences in question wording and other factors.
These data sources also have very different sample sizes – both the 2007 and 2014 Landscape Studies include interviews with roughly 35,000 respondents, while the GSS surveys have an average sample size of about 2,000.18 Since surveys with smaller samples are less likely to show statistically significant changes than surveys with larger samples, this appendix focuses on describing the general thrust of trends rather than on assessing the statistical significance of changes.
Religious Service Attendance
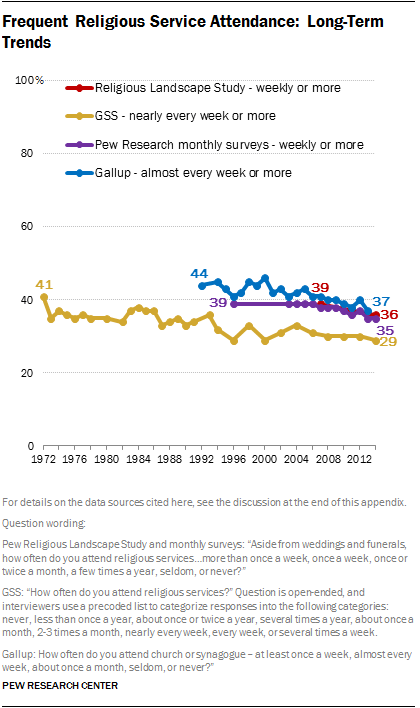
The Religious Landscape Studies, Gallup polls and the GSS all produce slightly different estimates of the share of Americans who say they attend religious services regularly, owing in part to the fact that each survey employs a different question to gauge religious attendance. All three sources, however, suggest that religious attendance may be gradually ticking downward.
The Religious Landscape Studies, for instance, find that the share of Americans who say they attend religious services “once a week” or “more than once a week” declined from 39% in 2007 to 36% in 2014. Other polls by Pew Research Center show a similar trend, from 38% in 2007 to 35% in 2014. Between 2007 and 2013 (the latest year for which data are available on this question), Gallup surveys show a 4-point decline (from 41% to 37%) in the share of Americans who say they attend religious services “at least once a week” or “almost every week.” In the 2014 GSS, 29% of respondents reported attending religious services “nearly every week” or more often, down slightly from 31% in 2006 and 30% in 2008. The GSS estimates of frequent attendance had previously been as low in 2000 and 1996. During the 1970s and 1980s, GSS results consistently indicated that at least a third of adults attended religious services “nearly every week” or more often.
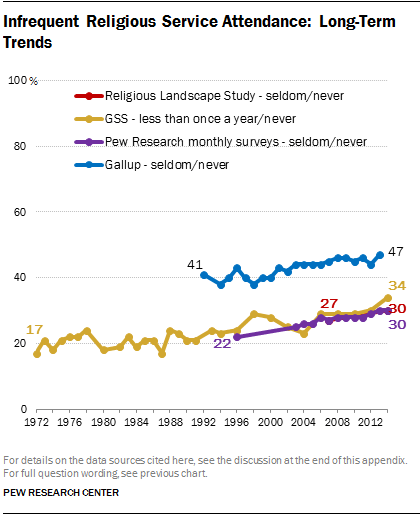
While the share of Americans who say they attend religious services weekly is declining, the share who say they rarely or never attend religious services is rising. The Landscape Studies and Pew Research Center monthly polls both find a 3-point jump between 2007 and 2014 in the share of adults who say they “seldom” or “never” attend religious services. Gallup surveys conducted in 2013 found 47% of adults saying they “seldom” or “never” attend religious services, up from 45% in 2007. The GSS finds that the share of Americans who say they never attend religious services or that they do so less than once a year has grown by 5 percentage points, from 29% in 2006 and 2008 to 34% in 2014.
Importance of Religion
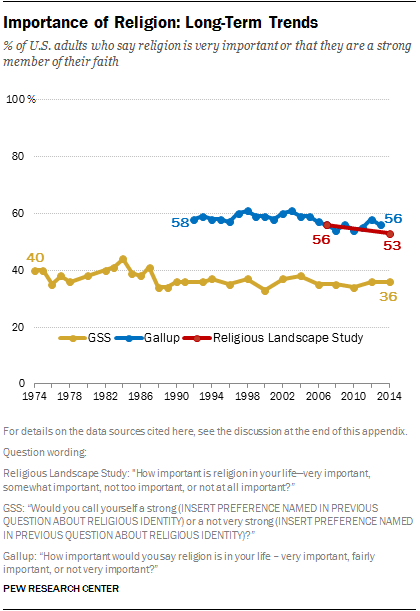
The direction of the trend is less clear in questions that ask respondents about how important religion is in their lives. The Religious Landscape Studies find that the share of adults who say religion is “very important” in their lives declined from 56% in 2007 to 53% in 2014. In Gallup surveys that ask a similar question, however, there is no clear indication of much change in the share of Americans who say religion is “very important” to them. In 2013 Gallup surveys, 56% of Americans said religion is very important to them, which is identical to Gallup surveys conducted in 2007. The share of adults who say religion is “very important” to them has fluctuated between 54% and 61% in Gallup polls conducted over the last two decades.
The GSS asks a unique question about religious intensity. It asks those who identify with a religion (i.e., everyone except the religious “nones”) whether or not they think of themselves as a “strong” adherent of their particular faith (e.g., Catholics are asked “Would you call yourself a strong Catholic, or not a very strong Catholic?”). The 2014 GSS finds that 36% of all U.S. adults say they have a strong affiliation to their religion, comparable to the 35% who said this in 2006 and 2008. The longer-term trend in the GSS suggests that strong identification with a faith may be lower today than in the 1980s, but it has not changed much in recent years.
Belief in God
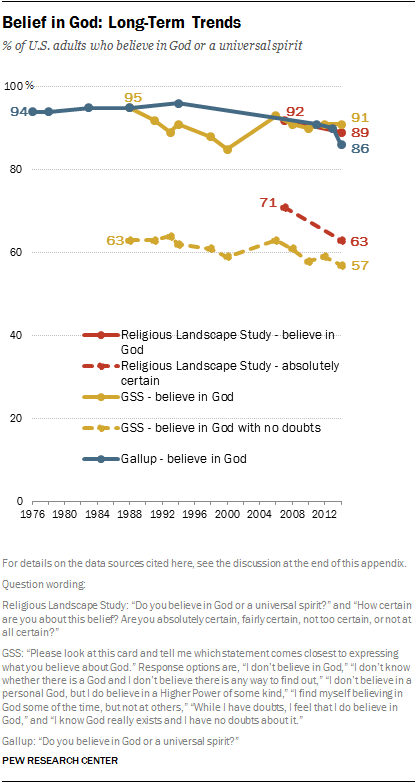
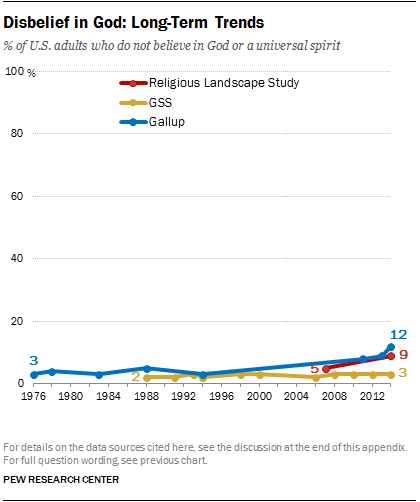
The Landscape Studies and Gallup polls include nearly identical questions about belief in God, asking respondents whether they “believe in God or a universal spirit.” And both data sources show recent declines in the share of Americans who say “yes” in response to this question. In the 2014 Religious Landscape Study, 89% of Americans say they believe in God or a universal spirit, down from 92% in 2007. In a 2014 Gallup poll, 86% of Americans said “yes” when asked if they believe in God or a universal spirit, the lowest figure since the question was first asked in 1976.
The trend in belief in God is less clear in the GSS. The GSS, which is conducted mostly via face-to-face interviews, directs respondents to look at a card and say which of six statements “comes closest” to describing their belief about God. The responses include “I don’t believe in God,” “I don’t know whether there is a God and I don’t believe there is any way to find out,” “I don’t believe in a personal God, but I do believe in a Higher Power of some kind,” “I find myself believing in God some of the time, but not at others,” “While I have doubts, I feel that I do believe in God,” and “I know God really exists and I have no doubts about it.”
The latter four categories from the GSS question can be combined to estimate the share of Americans who believe in God at all, including those who have doubts about God’s existence and those who do not believe in a personal God. When examined this way, the GSS data suggest that about nine-in-ten Americans believe in God. GSS findings on this question have fluctuated between a low of 85% in 2000 and a high of 95% in 1988.
But while overall belief in God appears not to have changed much in recent years, absolutely certain belief in God does appear to be ticking downward. In the 2014 GSS, 57% of respondents said they “know God really exists” and that they “have no doubts about it,” down from 63% in 2006 and 61% in 2008. By comparison, the Landscape Studies find that the share of Americans who are “absolutely certain” that God exists declined from 71% in 2007 to 63% in 2014.
At the other end of the spectrum, the Religious Landscape Studies and Gallup polls both find that growing shares of Americans say they do not believe in God or a universal spirit. Fewer GSS respondents reject belief in God altogether.
Beliefs About the Bible
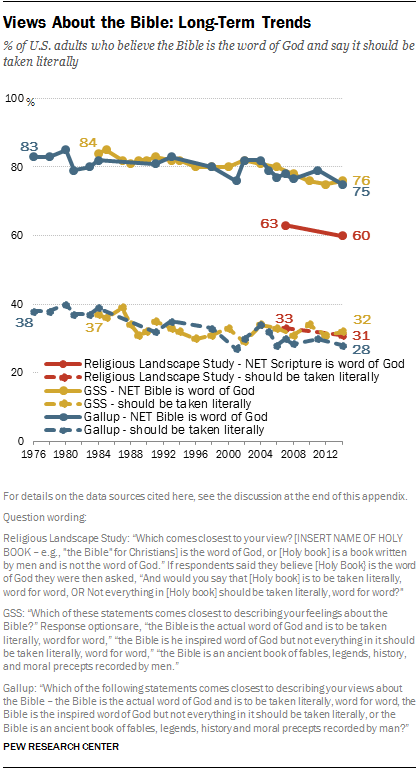
The Religious Landscape Studies, the GSS and Gallup all find modest declines in the share of Americans who say they believe the Bible is the word of God. In the 2014 Landscape Study, 60% of adults say they believe the Bible is the word of God, down from 63% in 2007. The Landscape Study also finds a slight decline in the share of adults who say they believe the Bible should be interpreted literally, from 33% to 31%.
In the 2014 GSS, 76% of respondents said they believe the Bible is either the “actual” or the “inspired” word of God, down from 80% in 2006 and a high of 85% in 1985. The share of adults in the GSS who say the Bible is the “actual” word of God and should be taken literally has been fairly stable in recent years but shows an overall decline since a high of 40% three decades ago.
Like the Landscape Studies and the GSS, Gallup polls also show modest declines in recent years in the share of Americans who believe the Bible is the “actual” or “inspired” word of God.
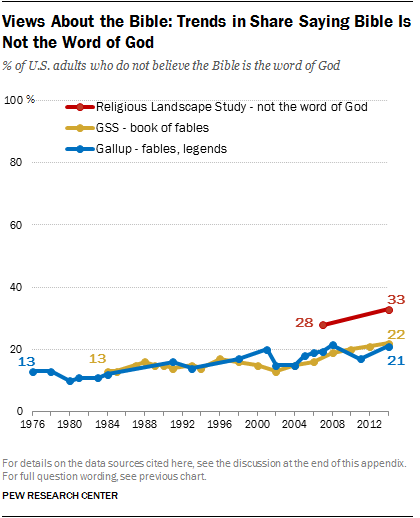
As the share of adults who say they believe the Bible is the word of God has declined, the Landscape Studies find the share who say it is not the word of God has increased from 28% in 2007 to 33% in 2014. Similarly, the GSS finds a 6-point increase between 2006 and 2014 in the share of Americans who say they believe “The Bible is an ancient book of fables, legends, history, and moral precepts recorded by men.” And Gallup polls indicate that this sentiment (that the Bible is a book of fables and legends) has been increasing over the long term.
Daily Prayer
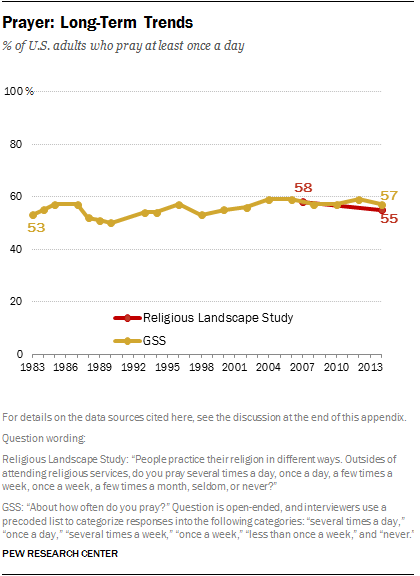
In the 2014 Religious Landscape Study, 55% of adults say they pray every day, down from 58% in 2007.
In the 2014 GSS, 57% said they pray every day, down from 59% in both 2006 and 2004. Interestingly and importantly, however, the GSS suggests that more people pray regularly today than was the case in the 1980s and 1990s.
Church Membership
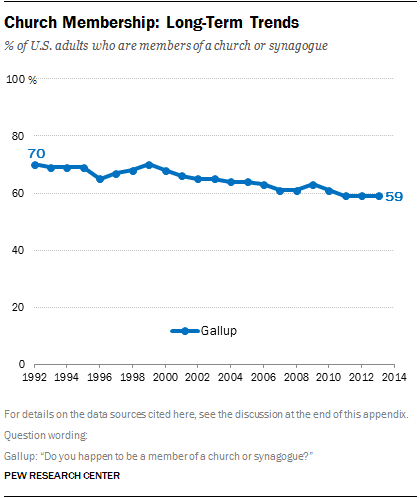
The Religious Landscape Study includes a question about membership in a religious congregation, with 49% of adults indicating they, personally, are members of a local church, synagogue, mosque or other house of worship. However, this question was not asked in the 2007 Landscape Study, meaning trend information is not available.
Gallup surveys, however, have consistently asked Americans a different question about congregational membership. They ask, “Do you happen to be a member of a church or synagogue?” Gallup finds that congregational membership has been steadily declining, from 70% in 1992 and 63% as recently as 2009 to 59% today.
Self-Identity as a Religious or Spiritual Person
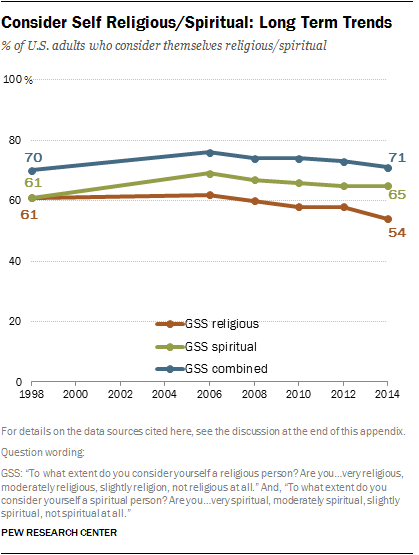
The GSS finds that the share of American adults who consider themselves very or moderately religious or spiritual increased between the late 1990s and the mid-2000s but has declined since then. Roughly six-in-ten U.S. adults (62%) said they were religious in 2006, while 54% said the same in 2014. And about seven-in-ten adults (69%) said they were spiritual in 2006, compared with 65% in 2014. Combined, the GSS indicates that the share of Americans who are religious or spiritual (or both) has declined by 5 percentage points in recent years, from a high of 76% in 2006 to 71% in 2014. The share of U.S. adults who describe themselves as either religious or spiritual is now on par with GSS results from the late 1990s.
The Religious Landscape Studies do not include a comparable question asking respondents whether they think of themselves as spiritual or religious.
Details on Data Sources
General Social Surveys were conducted once annually from 1972-1978; in 1980; in 1982; once annually from 1983-1991; in 1993; and once every two years beginning in 1994. Sample sizes for GSS surveys range from 1,372 to 4,510 and average about 2,000. For more information, see: Smith, Tom W., Peter Marsden, Michael Hout, and Jibum Kim. General Social Surveys, 1972-2014 [machine-readable data file] /Principal Investigator, Tom W. Smith; Co-Principal Investigator, Peter V. Marsden; Co-Principal Investigator, Michael Hout; Sponsored by National Science Foundation. – NORC ed. – Chicago: National Opinion Research Center [producer]; Storrs, CT: The Roper Center for Public Opinion Research, University of Connecticut [distributor], 2013.
Gallup data were accessed at http://www.gallup.com/poll/1690/religion.aspx.
Results from Pew Research Center monthly surveys reflect yearly aggregated data from polls conducted in 2009 (the first year in which most Pew Research Center surveys were conducted in both English and Spanish) through 2014. In total, this analysis draws on more than 50 separate polls and interviews with more than 110,000 respondents. See https://www.pewresearch.org/.


