
The religious profiles of U.S. adults – how religious they are and what religion they identify with – are closely aligned with their partisan political identities, according to the new Religious Landscape Study (RLS).
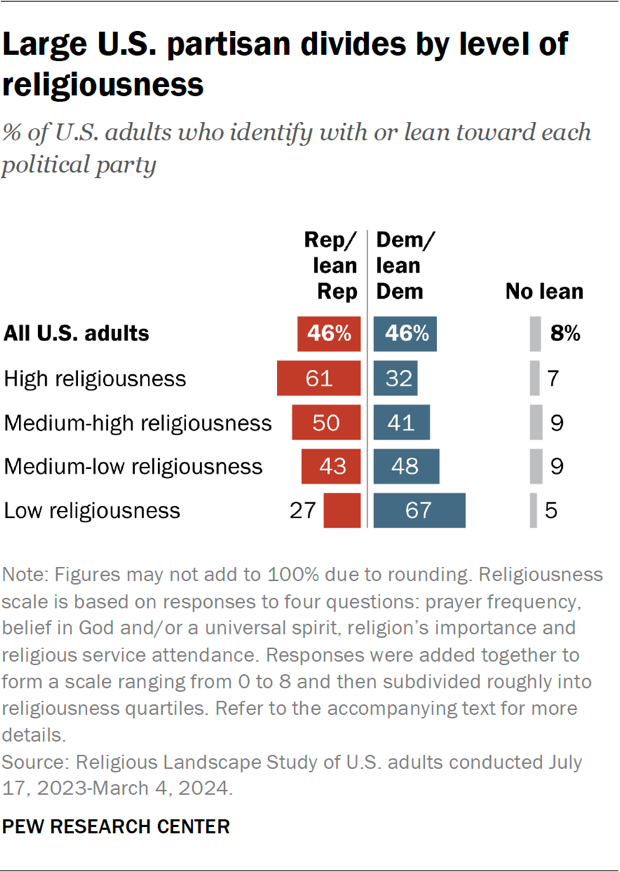
Generally speaking, Americans who are highly religious are the most solidly Republican constituency. U.S. adults with lower levels of religious engagement more commonly identify with or lean toward the Democratic Party.66
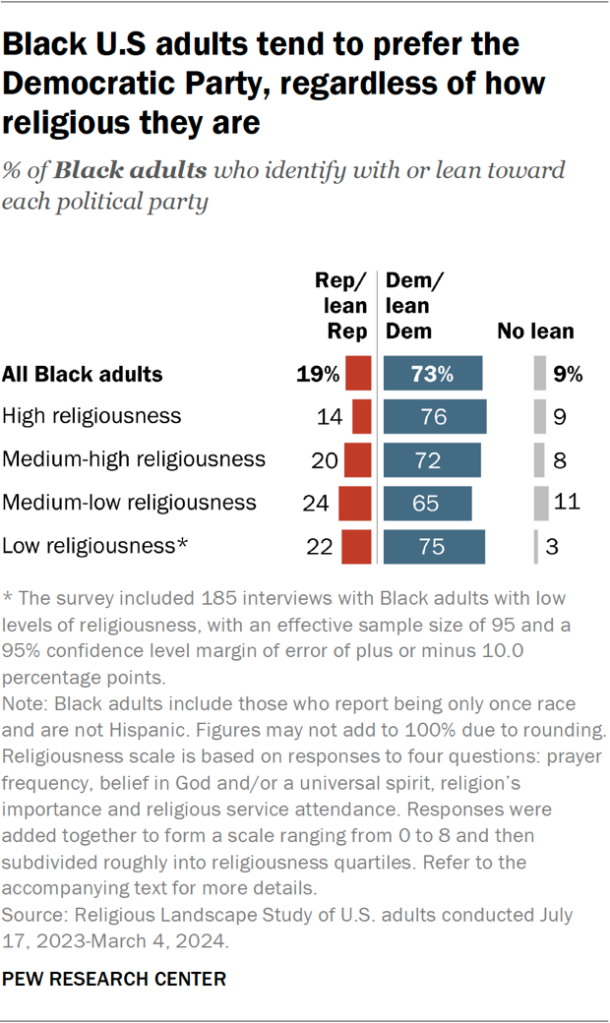
However, Black Americans are a notable exception: At all levels of religiousness, most identify as Democrats or lean toward the Democratic Party.
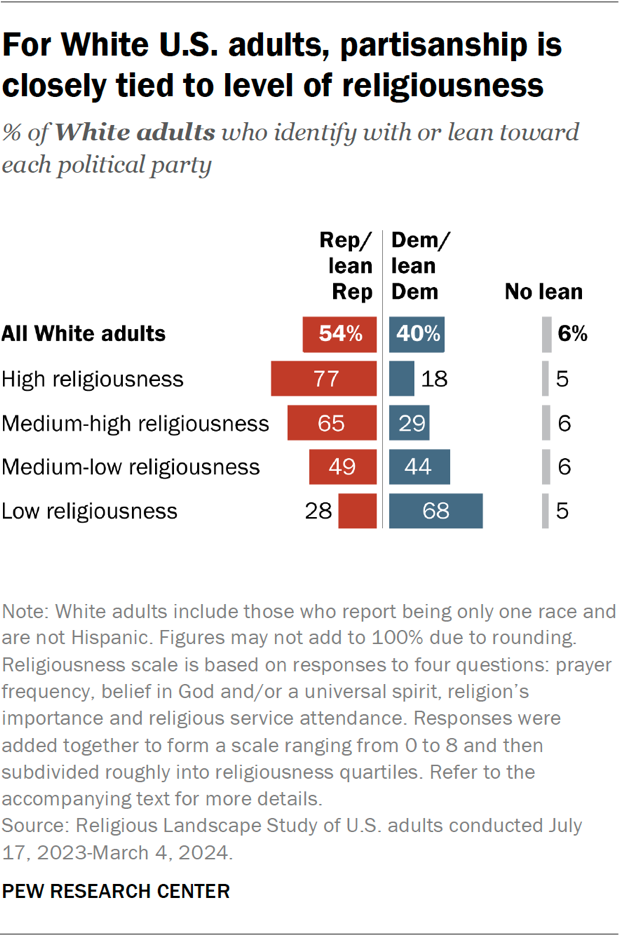
White Americans are far more divided than other racial groups by level of religiousness.
Among highly religious White Americans, a solid majority identify with the Republican Party or lean Republican (77%). Among White Americans with low levels of religious engagement, a sizable majority identify with or lean toward the Democratic Party (68%).
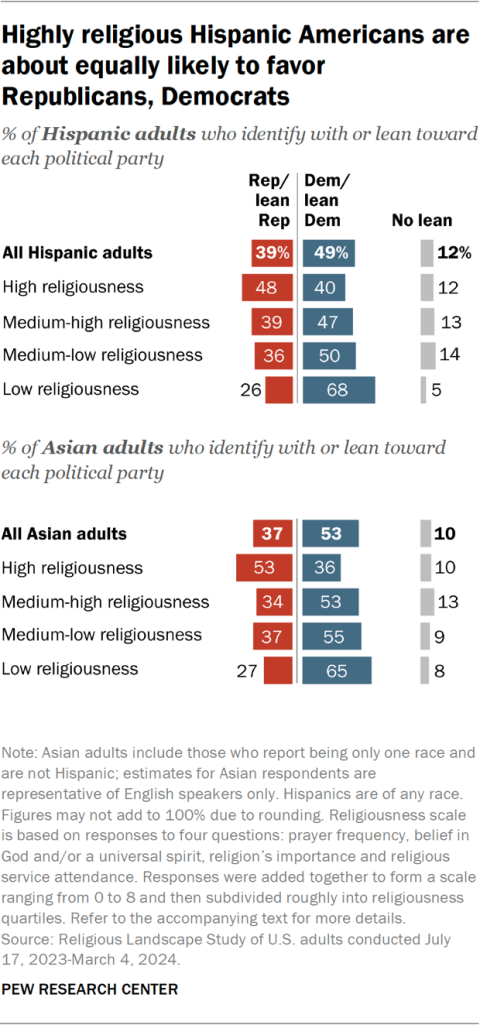
Hispanic Americans, Asian Americans and Americans of other races and ethnicities also are somewhat politically divided by their levels of religiousness, but the gaps are not as wide as among White Americans.
For example, 48% of highly religious Hispanic Americans identify as Republican or Republican-leaning and 40% identify as Democratic or Democratic-leaning. (The rest say they do not lean toward either party.) Among Hispanic Americans with low levels of religious engagement, a clear 68% majority lean toward the Democratic Party.
Black Americans largely support the Democratic Party regardless of their level of religiousness, with about three-quarters in both the high and low religiousness categories siding with the Democratic Party.
(Results about partisanship and ideology from this new survey cannot be compared with the previous 2007 and 2014 Religious Landscape Studies due to differences in the way the surveys were conducted.67)
Read on to learn about the political and ideological views of specific religious groups.
Political orientation and political ideology by religious affiliation
The U.S. public is very evenly divided politically: In the 2023-24 RLS, 46% of Americans identify with or lean toward the Republican Party, and 46% identify with or lean toward the Democratic Party.
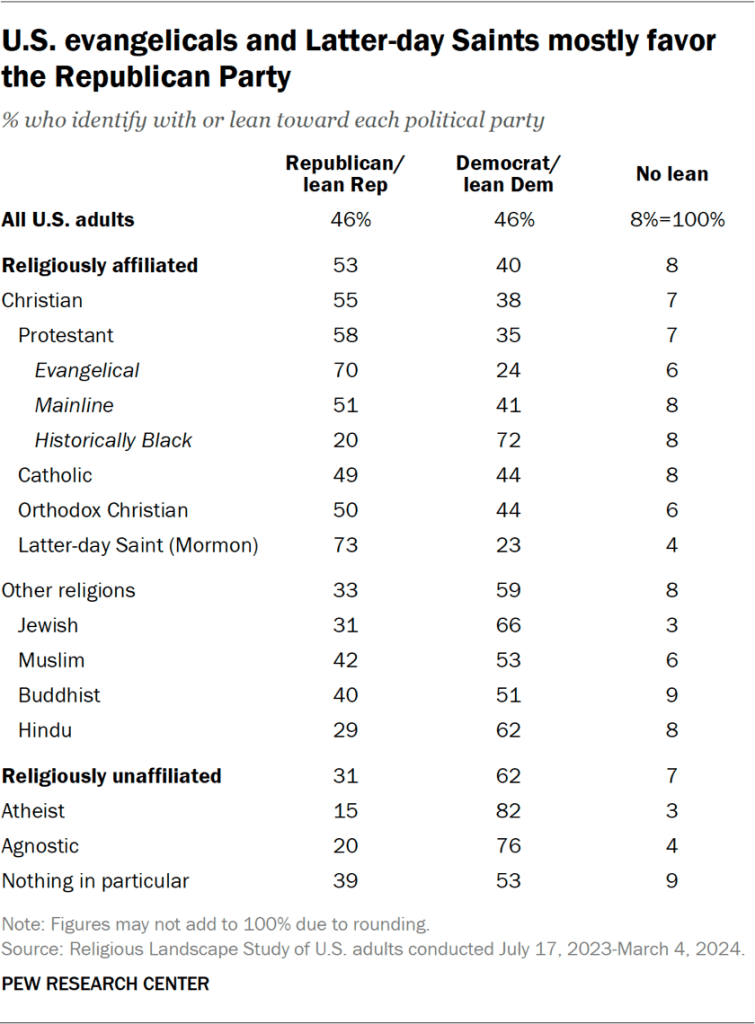
The remaining 8% of U.S. adults consider themselves independents or “something else,” or did not answer the question and don’t lean toward either party.
(Read our recent analysis of trends in party identification over time.)
Some religious groups strongly favor one party over the other:
- Evangelical Protestants and members of the Church of Jesus Christ of Latter-day Saints (widely known as Mormons) largely identify with or lean toward the Republican Party (70% and 73%, respectively).
- Historically Black Protestant church members (72%), Jewish Americans (66%) and Hindus (62%) mostly identify with or lean toward the Democratic Party, as do atheists (82%) and agnostics (76%).
Mainline Protestants favor the GOP (51%) over the Democratic Party (41%). Among Catholics, 49% are Republicans and GOP leaners while 44% are Democrats or Democratic leaners.
Within some religious groups, there are large differences by race:
- Hispanic Catholics tend to favor the Democratic Party (54%), while White, non-Hispanic Catholics favor the GOP (60%).
- Among evangelical Protestants, the Republican preference is much more pronounced among White evangelicals (80%) than among Hispanic evangelicals (58%).
On a separate question asking respondents to describe their political views, 33% of U.S. adults identify as conservative or very conservative and 24% identify as liberal or very liberal. An additional 38% identify as moderate, and 4% say they don’t know or give no answer.
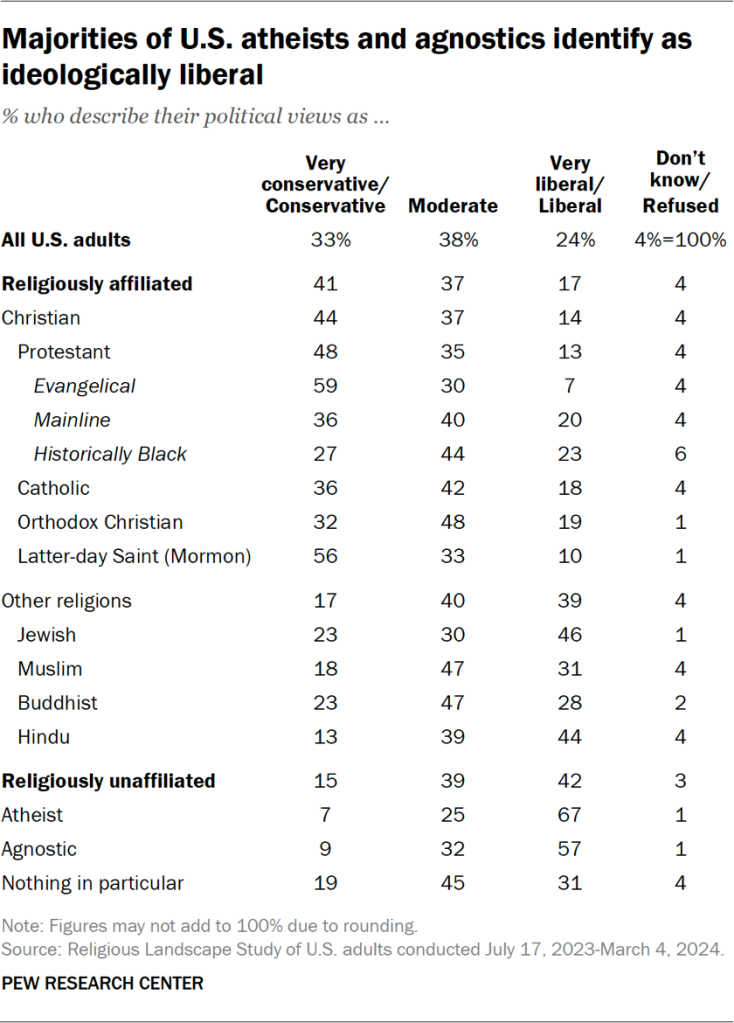
Religious groups’ responses about political ideology generally track partisan patterns, though most religious groups also have substantial shares that describe themselves as politically moderate.
The only groups in which about half or more adults identify as ideologically conservative are evangelical Protestants (59%) and Latter-day Saints (56%).
And the only groups with a majority who identify as ideologically liberal are atheists (67%) and agnostics (57%).
About half of members of the historically Black Protestant tradition, Orthodox Christians, Muslims, Buddhists and Americans who identify religiously as “nothing in particular” say they are moderate or give no answer.


