Numbers, Facts and Trends Shaping Your World

STEM Jobs See Uneven Progress in Increasing Gender, Racial and Ethnic Diversity

Appendix A: Detailed charts and tables

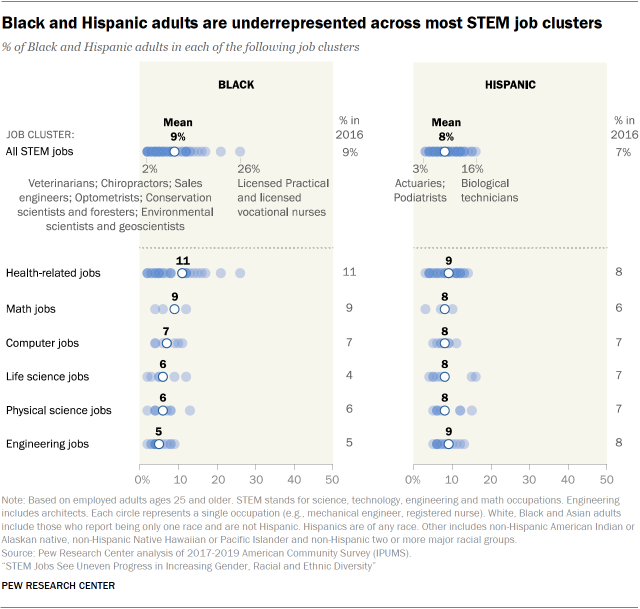
Chart shows Black and Hispanic adults are underrepresented across most STEM job clusters
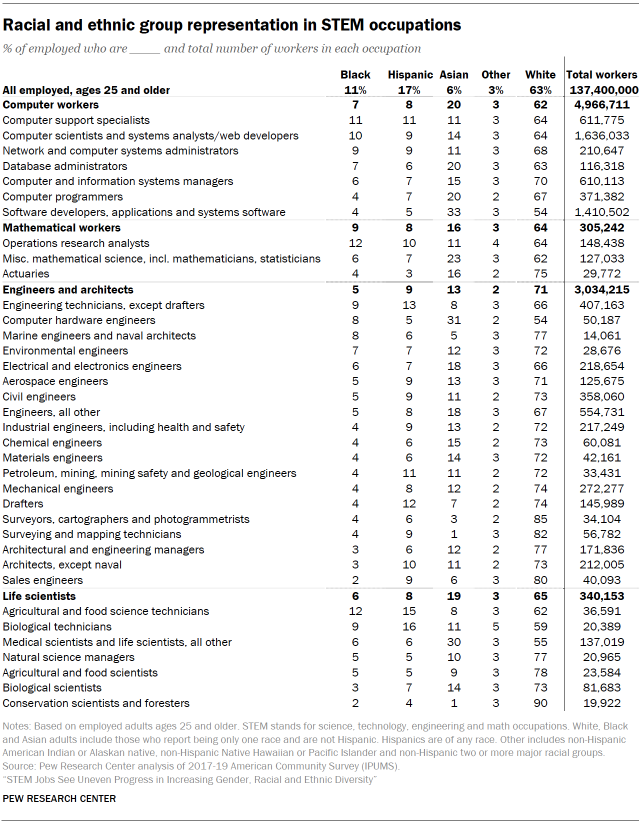
Chart shows racial and ethnic group representation in STEM occupations
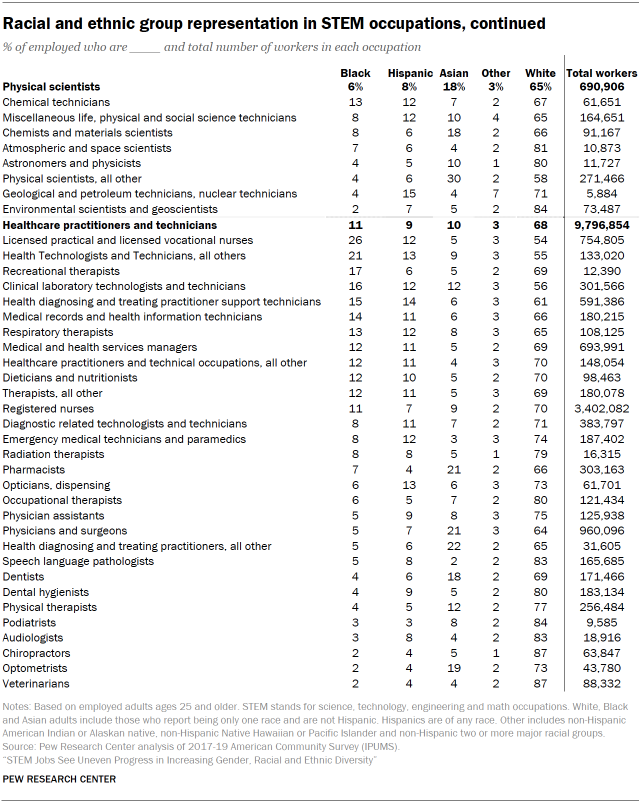
Chart shows racial and ethnic group representation in STEM occupations, continued
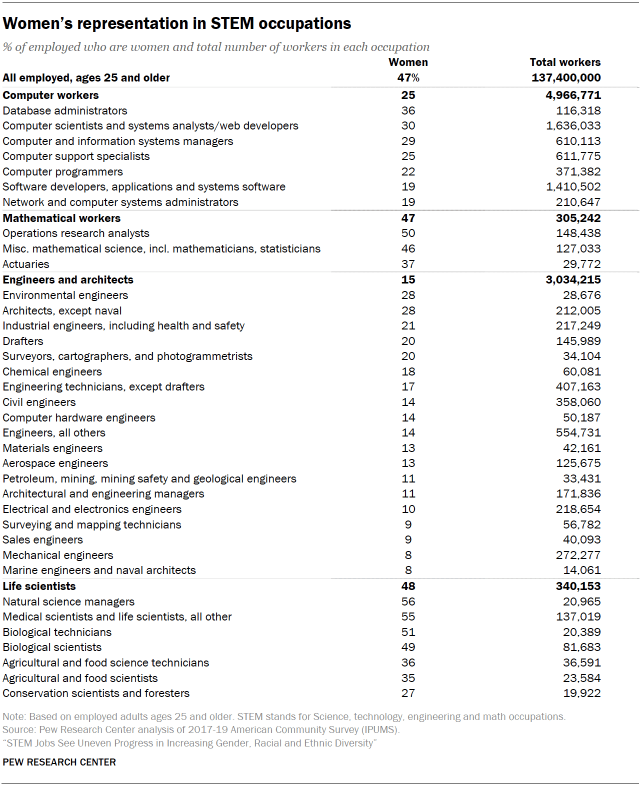
Chart shows women’s representation in STEM occupations
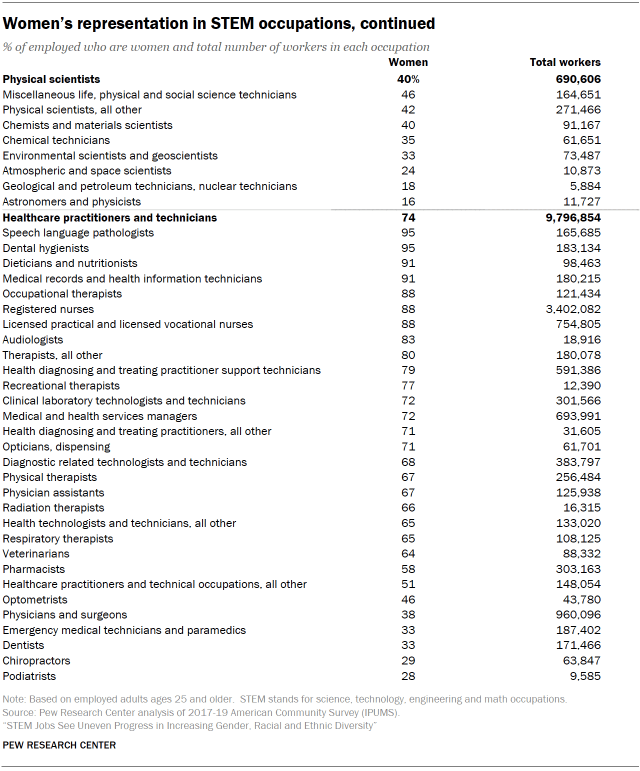
Chart shows women’s representation in STEM occupations, continued
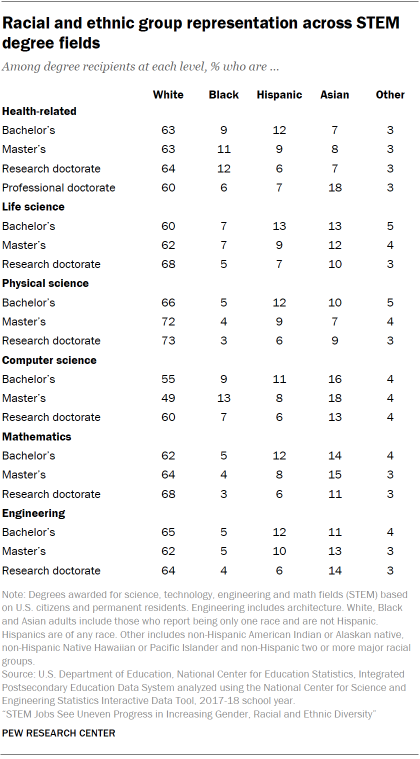
Chart shows racial and ethnic group representation across STEM degree fields
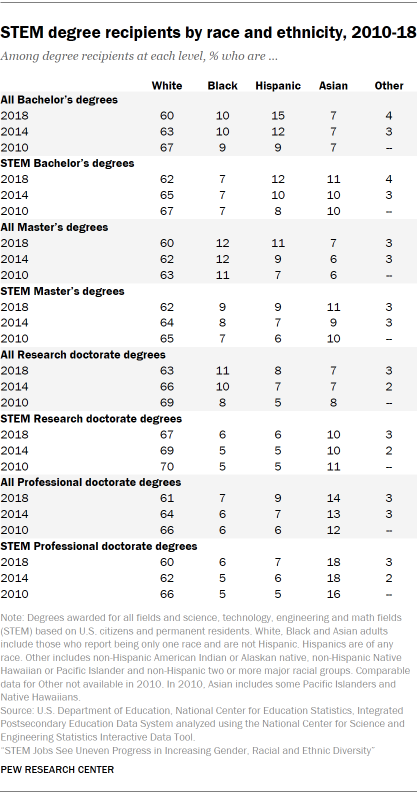
Chart shows STEM degree recipients by race and ethnicity, 2010-18

← Prev Page
1 2 3
Next Page →
Icon for promotion number 1

Sign up for The Briefing

Weekly updates on the world of news & information

Icon for promotion number 1

Sign up for our weekly newsletter

Fresh data delivery Saturday mornings