Earlier this year, we released our 6th political typology, which sorts American voters into eight distinct groups based on questions we ask the public about their shared values. Now that the midterm elections are nearly here, we were curious: How will these typology groups vote on Nov. 4 – or will they vote at all?
Our analysis found that three of the eight groups are far more likely to show up to vote than the rest. These groups are also those who are the most ideological, highly politically engaged and overwhelmingly partisan – two groups are on the right and one on the left.

First, a little background about our typology and analysis. The typology groups are based on data from our massive political typology survey, a nationally representative group of 10,013 American adults. We then recruited survey respondents from that initial representative telephone survey into what’s called a panel – a group of people who agree to take monthly surveys with us over the course of the year. By going back regularly to the same nationally representative group, we are able to gain insights from them over time and, in this case, see how their engagement with the 2014 midterm elections may have changed over time.
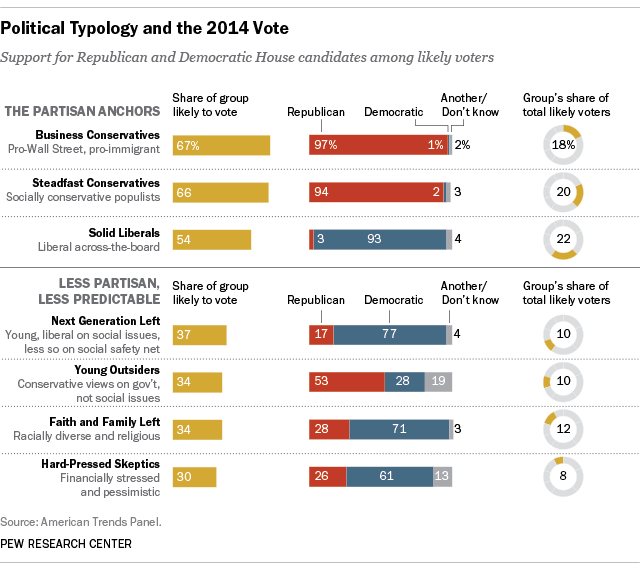
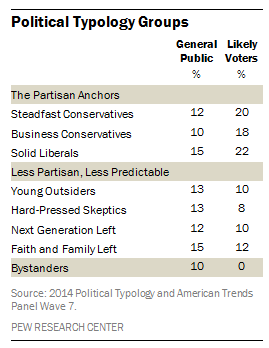
Our most recent panel survey, conducted Sept. 9-Oct. 3 with 3,154 adults — including 2,150 likely voters — checks back in with Americans interviewed for the political typology study. It finds that the two strongest Republican groups – the Business Conservatives and the Steadfast Conservatives – are more motivated to vote than other groups, with 67% and 66%, respectively, likely to turn out. Steadfast Conservatives are staunch critics of government and are socially conservative. Business Conservatives prefer limited government, but are far more moderate on social issues than Steadfast Conservatives and favor immigration reform. We estimate that these two groups constitute only 22% of the general public, but because they are so engaged with politics, these groups make up 38% of the likely electorate.

On the left, the Solid Liberals are solidly Democratic in their vote preference (93%) among likely voters and are uniformly liberal across nearly every realm – government, the economy, business, the environment and foreign policy, as well as on social issues. But they are somewhat less likely than the two conservative groups to vote; we forecasted that 54% of them will turn out to vote.
The other large and diverse typology groups in the center are comparatively less united around a specific party, and less likely to vote in November.
Democratic prospects rest with three other groups who lean Democratic but less strongly than the Solid Liberals. The Next Generation Left is a young and relatively affluent group with liberal attitudes on social issues, regulation and foreign policy. But they are lukewarm about the social safety net. In all, 77% plan to vote Democratic; just 37% are likely to vote.
The Faith and Family Left is a pro-government group but it is cross-pressured by its strong religious beliefs and relatively conservative views on social issues. About seven-in-ten (71%) say they will vote Democratic in the race for Congress; 34% are forecast to turn out.
The last Democratic-leaning group is the Hard Pressed Skeptics. They favor the social safety net but have strong reservations about both government and business. Just 61% say they will vote Democratic, and only 30% are likely to vote.
All three groups include important parts of the Democratic coalition that have fared unevenly in the slow economic recovery: minorities (in the Faith and Family Left), young people (in the Next Generation Left) and those with relatively low levels of education (the Hard Pressed Skeptics). Together, they will make up about 30% of all voters, despite constituting 40% of all American adults.
On the right, the Young Outsiders are conservative on economic issues and express more support for Republican (53%) than Democratic candidates (28%). But their less conservative views on social issues put them at odds with many GOP candidates. Only about one-third (34%) are forecasted to turn out, which would make them 10% of the total electorate, compared with 14% of the general public.
One other group warrants a mention: the Bystanders. This group, representing 10% of the public, is made up of those unengaged in the political process and who are not registered to vote.
Details about the surveys described here, which include Political Polarization, Political Typology, and the latest wave of the American Trends Panel, can be found on our website.
Take the Political Typology Quiz and learn which of the Political Typology types is your best match.
