On Election Day, can’t you just smell the excitement in the air? Actually, you probably can’t: An overwhelming majority of voters live in congressional districts with little real competition, and a handful without any at all.

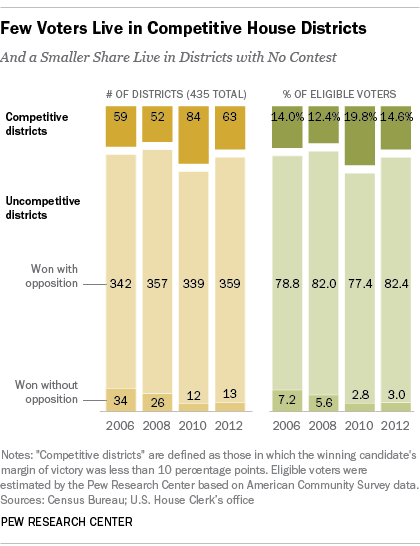
A Pew Research Center report last week used ratings and analyses by such sources as the Cook Political Report and Real Clear Politics to estimate that there are only 14 truly competitive House elections this year. But the ratings are only predictions, and if history is any guide several more House races will turn out closer than expected. In 2012, for instance, 29 House candidates won by less than 5 percentage points over their closest rival; another 34 won by at least five but fewer than 10 percentage points. Still, that’s only 63 races out of 435 House districts, representing around 15% of eligible voters.
We wondered how those figures compare with earlier elections, so we examined data from two separate sources. Using data from the Census Bureau’s American Community Survey, we estimated how many eligible voters there were in each congressional district from 2006 (when the ACS series begins) through 2012. (Quick refresher: Eligible voters are 18 years or older and either native-born or naturalized U.S. citizens.) We obtained vote totals for every House race from the House Clerk’s office.
As it turns out, the number of close races — those decided by fewer than 5 percentage points — doesn’t vary all that much from election cycle to election cycle: from a low of 25 in 2008 up to 38 in the Tea Party year of 2010, when Republicans regained control of the House. Raising the victory-margin threshold to 10 percentage points roughly doubled the number of districts that could be considered competitive. Even so, at least eight of every 10 eligible voters resided in districts without competitive races.
Most House races, in fact, aren’t close at all. A 2006 Brookings Institution study noted that since 1998, House incumbents have been re-elected more than 98% of the time. In 2012, our analysis found, victors on average took 65% of the total vote, about the same as the average winner’s share in 2006 (66.2). Last time around, more than half (242) of winning House candidates beat their nearest challengers by 25 percentage points or more.
That, of course, assumes they even had challengers. In 2012, 13 winners either were completely unopposed or faced only write-in candidates, meaning 6.6 million eligible voters had no real choice as to who their representative would be. But unopposed candidates are scarcer now than they have been: In 2006, 34 candidates won House seats without having to face actual opponents.
The lack of suspense in most House elections may help explain why public attention this campaign cycle is lagging — despite the estimated $3.67 billion spent on them. In a Pew Research Center survey from mid-October, 56% said they were following news about the elections in their state and district “very” or “fairly” closely, down from 62% in 2010 and 64% in 2006.
