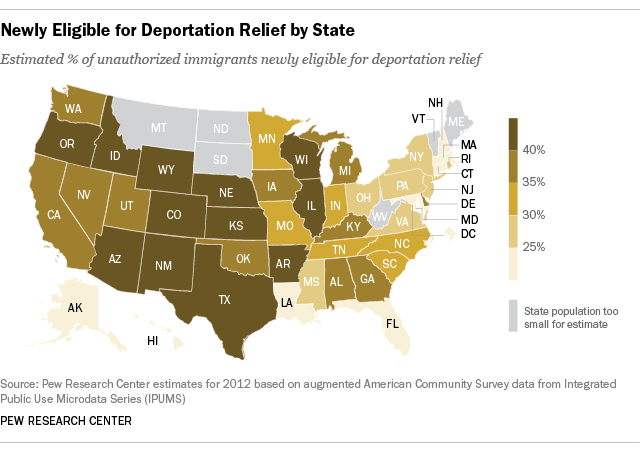
At least four-in-ten unauthorized immigrants in 12 states will be eligible to benefit from the executive actions announced Thursday by President Obama, according to a new Pew Research Center analysis.
Idaho, where 46% of the state’s unauthorized immigrant population is eligible for deportation relief, tops all other states on this measure. Other states with at least four-in-ten eligible immigrants include Arizona, Arkansas, Colorado, Illinois, Kansas, Nebraska, New Mexico, Oregon, Texas, Wisconsin and Wyoming.
More than 5 million unauthorized immigrants are eligible for deportation relief under Obama’s executive action announced Thursday or the president’s 2012 Deferred Action for Childhood Arrivals, which grants relief to young adults who came to the U.S. as children. The new executive action also expands the DACA program.
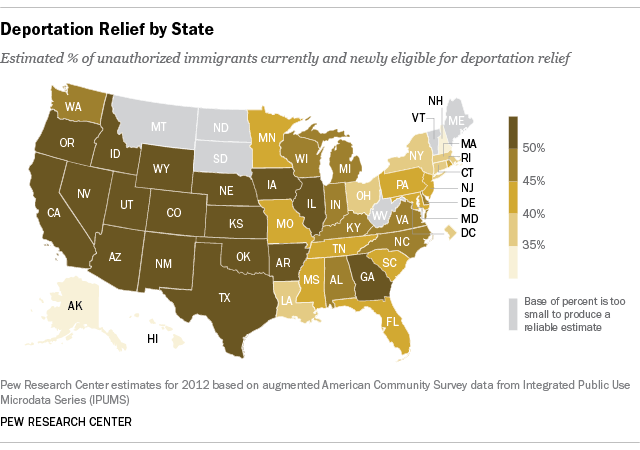
When we expand our analysis to those eligible under both the new executive action and those already covered the president’s DACA program, it’s clear that many Western states, including those with the highest shares of unauthorized immigrants in their total population, are affected. With both programs combined, Idaho again tops the list, with about six-in-ten (62%) unauthorized immigrants now eligible for relief, the highest share in the nation, according to the Pew Research analysis of 2012 data.

Though Idaho has the highest share of unauthorized immigrants affected by Obama’s immigration policies, it has a relatively small population of unauthorized immigrants. Idaho’s 50,000 unauthorized immigrant population is dwarfed by the 2.5 million in California and the 1.7 million in Texas. Both California (52%) and Texas (54%) are among the states where at least half of unauthorized immigrants are now eligible for relief. Nationwide, 48% of unauthorized immigrants are eligible for relief under new or existing programs.
The states that have high shares of unauthorized immigrants who are eligible for relief also have high shares of unauthorized immigrants from Mexico. People from Mexico account for two-thirds of unauthorized immigrants who will be eligible for deportation relief under Obama’s new executive action, according to a Pew Research analysis.
In Nevada, where President Obama traveled Friday to talk about his actions, those newly eligible for relief make up 39% of the state’s unauthorized immigrant population. The state’s total of 210,000 is relatively small compared with other states. Nevada is also one of 14 states where the unauthorized immigrant population decreased from 2009 to 2012, a trend driven largely by a drop in the number of unauthorized immigrants from Mexico.
But Nevada stands out on several measures of unauthorized immigration. Nevada has the nation’s highest share of unauthorized immigrants as a share of the state overall population (8%), the labor force (10%) and K-12 students with at least one unauthorized parent (18%).
| State | Unauthorized Immigrants 2012 | Total Eligible for Protection | Newly Eligible for Protection | Percent Eligible | Percent Newly Eligible |
|---|---|---|---|---|---|
| U.S., Total | 11,200,000 | 5,350,000 | 3,850,000 | 48% | 35% |
| California | 2,450,000 | 1,250,000 | 950,000 | 52% | 39% |
| Texas | 1,650,000 | 900,000 | 675,000 | 54% | 41% |
| Florida | 925,000 | 375,000 | 210,000 | 41% | 23% |
| Illinois | 475,000 | 250,000 | 200,000 | 53% | 42% |
| New York | 750,000 | 300,000 | 200,000 | 39% | 26% |
| Georgia | 400,000 | 190,000 | 140,000 | 50% | 37% |
| New Jersey | 525,000 | 210,000 | 140,000 | 40% | 28% |
| Arizona | 300,000 | 160,000 | 120,000 | 53% | 40% |
| North Carolina | 350,000 | 170,000 | 120,000 | 48% | 34% |
| Washington | 230,000 | 110,000 | 85,000 | 47% | 36% |
| Nevada | 210,000 | 110,000 | 80,000 | 52% | 39% |
| Colorado | 180,000 | 100,000 | 75,000 | 56% | 42% |
| Virginia | 275,000 | 130,000 | 75,000 | 46% | 27% |
| Maryland | 250,000 | 110,000 | 60,000 | 43% | 24% |
| Oregon | 120,000 | 65,000 | 50,000 | 52% | 43% |
| Pennsylvania | 170,000 | 65,000 | 45,000 | 40% | 28% |
| Michigan | 120,000 | 55,000 | 40,000 | 46% | 36% |
| Oklahoma | 100,000 | 50,000 | 40,000 | 50% | 39% |
| Tennessee | 130,000 | 55,000 | 40,000 | 43% | 31% |
| Utah | 100,000 | 55,000 | 40,000 | 53% | 39% |
| Massachusetts | 150,000 | 60,000 | 35,000 | 38% | 22% |
| Wisconsin | 85,000 | 40,000 | 35,000 | 48% | 40% |
| Connecticut | 130,000 | 45,000 | 30,000 | 35% | 24% |
| Indiana | 85,000 | 40,000 | 30,000 | 47% | 34% |
| Kansas | 75,000 | 40,000 | 30,000 | 54% | 41% |
| Minnesota | 95,000 | 40,000 | 30,000 | 44% | 34% |
| New Mexico | 70,000 | 35,000 | 30,000 | 52% | 42% |
| South Carolina | 95,000 | 40,000 | 30,000 | 43% | 33% |
| Alabama | 65,000 | 30,000 | 25,000 | 49% | 37% |
| Arkansas | 60,000 | 35,000 | 25,000 | 58% | 42% |
| Nebraska | 55,000 | 30,000 | 25,000 | 57% | 44% |
| Ohio | 95,000 | 35,000 | 25,000 | 37% | 27% |
| Idaho | 50,000 | 30,000 | 20,000 | 62% | 46% |
| Missouri | 65,000 | 30,000 | 20,000 | 43% | 32% |
| Iowa | 40,000 | 20,000 | 15,000 | 51% | 38% |
| Kentucky | 35,000 | 15,000 | 15,000 | 46% | 38% |
| Louisiana | 55,000 | 20,000 | 15,000 | 38% | 23% |
| Delaware | 20,000 | 10,000 | 10,000 | 46% | 37% |
| Rhode Island | 35,000 | 15,000 | 10,000 | 41% | 28% |
| Hawaii | 35,000 | 10,000 | 5,000 | 30% | 21% |
| Mississippi | 25,000 | 10,000 | 5,000 | 44% | 28% |
| Alaska | 15,000 | <5,000 | <5,000 | 8% | 4% |
| District of Columbia | 20,000 | 5,000 | <5,000 | 37% | 17% |
| Maine | <5,000 | <5,000 | <5,000 | ** | ** |
| Montana | <5,000 | <5,000 | <5,000 | ** | ** |
| New Hampshire | 10,000 | <5,000 | <5,000 | 34% | 24% |
| North Dakota | <5,000 | <5,000 | <5,000 | ** | ** |
| South Dakota | <5,000 | <5,000 | <5,000 | ** | ** |
| Vermont | <5,000 | <5,000 | <5,000 | ** | ** |
| West Virginia | <5,000 | <5,000 | <5,000 | ** | ** |
| Wyoming | 5,000 | <5,000 | <5,000 | 50% | 40% |
Note: All numbers are rounded independently and are not adjusted to sum to the total U.S. figure or other totals. Percents calculated from unrounded numbers. See Methodology for rounding rules. When ranked, states with the same numbers or shares within the column that is ranked are shown alphabetically.
** State population too small for estimate.
Source: Pew Research Center estimates based on augmented 2012 American Community Survey data from Integrated Public Use Microdata Series (IPUMS)
Correction: This posting and accompanying graphics have been updated with revised estimates for most states on the share of unauthorized immigrants affected by the president’s action. A previous version of this post referred to the president’s implementation of his new immigration policy as an executive order. He has taken executive action.

